How democratic is the Westminster ‘plurality rule’ electoral system?
In the first part of our 2018 Audit of UK Democracy, Patrick Dunleavy examines a topic of foundational importance for any liberal democracy – how well does the electoral system (in this case the Westminster plurality rule, aka ‘first-past-the-post’) convert votes into seats? A sudden growth in two-party support in 2017 allowed the UK’s ancient voting system to work far more proportionately. But is this outcome a one-off blip, or the start of a new long-term trend?
 Photo by Jurica Koletić on Unsplash
What does democracy require for an electoral system?
- It should accurately translate parties’ votes into seats in the legislature (here the House of Commons nationally, and councils at local level in England and Wales),
- Votes should be translated into seats in a way that is recognised as legitimate by most citizens (ideally almost all of them).
- No substantial part of the population should regard the result as illegitimate, nor suffer a consistent bias of the system ‘working against them’.
- If possible, the system should have beneficial effects for the good governance of the country.
- If possible, the voting system should enhance the social representativeness of the legislature, and encourage high levels of voting across all types of citizens.
The plurality rule (or ‘first-past-the-post’) voting system
Used for:
- Choosing MPs in the Westminster Parliament
- Electing local councillors in England and Wales
How it works: The national territory is divided into constituencies, each electing one MP. Candidates stand for election from parties, and voters cast one vote (by marking an X) for their top preference choice only. The party candidate who gets the largest pile of votes in each local area is elected. To get elected the winner does not need to gain a majority (50% +1 of voters), but just needs more votes than anyone else. The more candidates there are, the lower the level needed to win may become.
Recent developments
Two general elections were held close together – in 2015 (at the end of five years of coalition government) and in 2017 (opportunistically called by Theresa May). They brought a whole host of dramatic alterations in how the voting system operated, reflecting recent large changes in the UK party system.
In 2015: The biggest upset occurred in Scotland where the Scottish National Party (SNP), still buoyed up by its 2014 independence referendum campaign, secured all but three of the 59 seats (95%) on the basis of 50% of the vote, a highly disproportional result. In England the anti-EU, UK Independence Party (UKIP) piled up over 14% of the votes, but won only one seat (that it already held). The initially third-placed Liberal Democrats’ vote plunged from 23.5% in 2010 to just 8%, and their seats fell from 57 to just 8 isolated survivors, spread across as many regions of the country. The party’s coalition government with the Conservatives was seen as a betrayal by many of their earlier voters. Disproportionality increased markedly in Scotland, and in the south-west region.
In 2017: Following the 2016 Brexit vote, the UKIP leader Nigel Farage resigned. A year later support for UKIP collapsed (partly on a ‘mission accomplished’ basis, and partly because of its lack of a recognisable leader). The Liberal Democrats’ vote share dropped a further 0.5% from its 2015 low. Despite these favourable conditions, the Conservative campaign in England backfired badly and they lost seats, despite boosting their UK votes share to over 42%, almost 6 percentage points higher than in 2015. The Tories did gain seats in Scotland, as some of the 2015 SNP surge drained away. Yet overall, the governing party was left reliant on a ‘confidence and supply’ deal with the Northern Ireland party, the Democratic Unionist Party (DUP), in order to hold on to power. The big gainer from the election was Labour under Jeremy Corbyn, whose support grew radically from just over 30% in 2015 to 40% in 2017. Much of the growth occurred during the last three weeks of Theresa May’s doomed 2017 campaign. The Liberal Democrats’ seats increased slightly from 8 to 12, but each was still an isolated bastion, seeming to cling on at the UK’s scattered extremities against the revival of the Labour and Conservative votes.
In Scotland, the SNP’s near ‘clean sweep’ in 2015 lasted only two years, and multi-party politics were restored there. The SNP’s support dropped sharply from its (probably unsustainable) peak of 50% to just below 37%, and the plurality rule system produced a radical reduction of its seats from 59 to 35. Labour’s modest bounce-back in Scotland, plus a Tory resurgence there under Ruth Davidson, gave both parties more seats at the SNP’s expense.
A mapping of seats by party in Figure 1 below also shows the return of what an earlier electoral reform commission called ‘electoral deserts’ in England and Wales, where one party wins almost all the seats. In 2017, these covered all of southern and eastern England (where the Conservatives were very strong); and the north-east, north-west industrial areas, south Wales and much of inner London (where Labour predominated). On the other hand, the Midlands became more diversified than in the past.
Figure 1: Seats won at the 2017 general election by the parties in the UK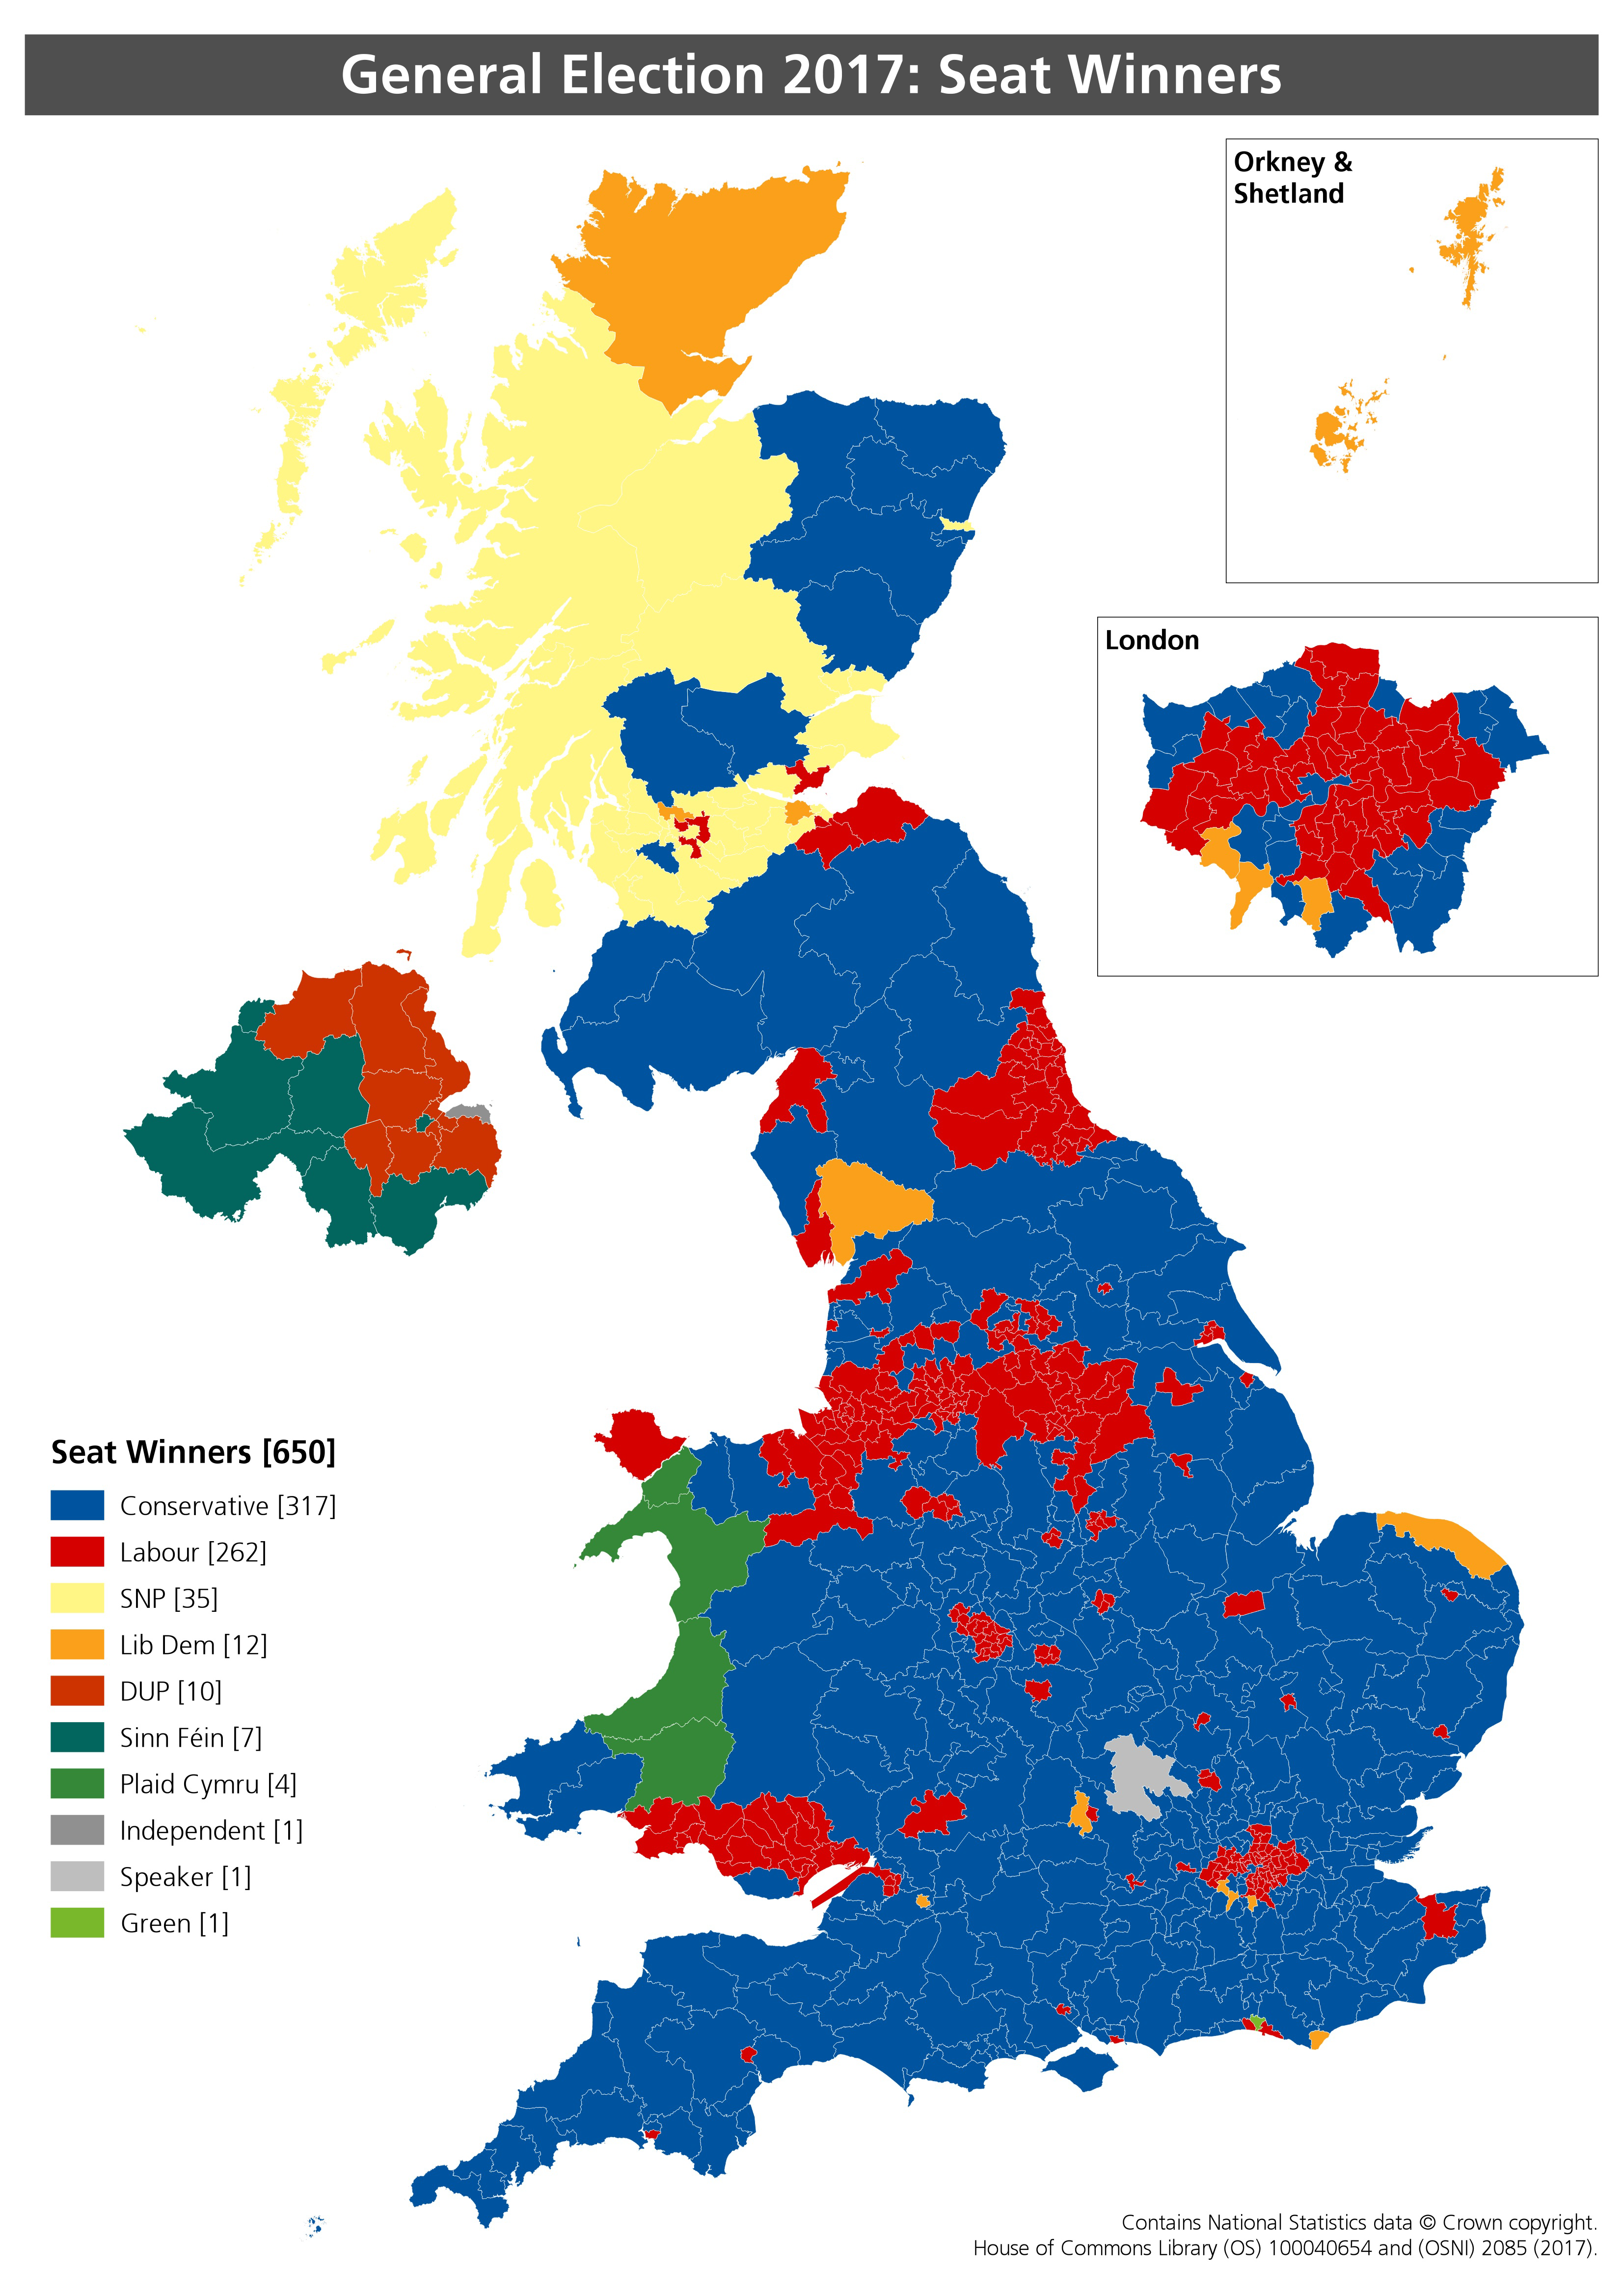 Source: Carl Baker et al, General Election 2017: results and analysis, House of Commons Library, Briefing Paper 7979
Strengths, Weaknesses, Opportunities, Threats (SWOT) analysis
| Current strengths | Current weaknesses |
|---|---|
| Plurality rule is an ancient and hence thoroughly familiar system for British voters, dating back to medieval times. | Large minorities of voters regard the seats awarded to the largest parties, and the lack of seats for smaller parties, as illegitimate and distorted. Seat shares in the Commons rarely match vote shares well. |
| It is simple for people to cast a vote (just mark one X against your top party/candidate). Votes are easy to count, and voters can easily understand how the result happened. | Many voters demand an alternative system – 32% in the 2011 AV referendum, and over two-fifths consistently favour PR systems in polls. |
| In a 2011 national referendum (promoted by the then very unpopular Liberal Democrats), 68% of UK voters supported the status quo rather than the reform option on offer, which was the alternative vote (AV) system (used in Australia). | Plurality rule always advantages the leading parties, those that can pile up enough votes to create many ‘stronghold’ seats. In the UK, this benefits either the Conservatives or Labour (depending who’s in the lead locally), and now the SNP in Scotland. |
| Turnout levels this century range from 59% to 69%, down on earlier levels. But 30.7 million people still voted in the 2015 Westminster elections. And this number increased sharply to 39.3 million in 2017 – more than for any other elected body. | The voting system heavily discriminates against parties with dispersed national support that only run second or third in many seats – especially the Liberal Democrats (plus UKIP in 2010 and 2015), who secure millions of votes but few or no Westminster MPs. (However, in 2017 UKIP’s support fell to 0.6 million votes.) |
| In British conditions, plurality rule in the past tended to produce ‘artificial’ majorities for the leading party. This ‘leader’s bonus’ then allowed single-party governments to be formed with ‘artificial’ House of Commons majorities. Advocates argue that this produces ‘strong’ government which is both what voters want and an important feature of UK democracy as a whole. | However, the system no longer produces strong government effect in any reliable way. Recent ‘exceptions’ include the Conservative-Liberal Democrat coalition government of 2010–15 (in an otherwise ‘hung’ Parliament), and the minority Conservative government since 2017 which relies on a ‘confidence and supply’ agreement with DUP MPs from Northern Ireland in order to stay in office. (Earlier examples of minority or near minority governments were 1964–66, 1974 and 1977–79.) |
| The system creates ‘electoral deserts’ for major parties – whole regions where they win millions of votes but no or few seats. So there are few Tories in northern, industrial cities; and few Labour MPs in southern England outside London. | |
| The proportion of MPs with local majority support has increased across the last three general elections, reaching a high of 72% in 2017. | The proportion of MPs enjoying local majority support in their seats fell over the long term from 1974 to 2005 (when it touched just 55%). |
| The proportion of citizens positively supporting the governing Conservatives in 2017 was 29.2%, an increase on the levels shown opposite. | Single-party governments are based on small minorities of voters (35–42% from 2001 to 2017), and even smaller proportions of positively supporting citizens (22–24% from 2001 to 2015). |
| When Labour won many university town and inner-city seats in 2017, helped by enthusiastic young supporters, media commentators were quick to identify a ‘youthquake’ in terms of young people re-participating in voting. This claim was declared a myth by the most orthodox political science study (the BES). However, their research has been disputed in turn, because the BES includes only small numbers of young people, from very few constituencies. Young people certainly voted more in 2017, in line with most social groups. | The proportion of MPs in Westminster holding seats not justified by their share of the votes was above a fifth between 1997 and 2015. However, this level fell sharply in 2017 (see below). |
| Westminster has only tiny proportions of people from manual working class backgrounds and from black and Asian ethnic minorities. Gender representation remains overwhelmingly male, with women MPs forming 20–29% of the total for the last two decades. In 2017, women MPs rose to 32% of the Commons, but this is still a long way from 50/50. In principle, parties could do better, even if plurality rule voting is retained. But in practice progress has been very slow. |
| Future opportunities | Future threats |
|---|---|
| A more proportional voting system is demanded by Liberal Democrats, UKIP, Greens, the SNP and Plaid Cymru. Many people in the Labour ranks also support change, but few Conservatives. | If more voters revert to supporting third- or fourth-placed parties (as they did until 2015, and as they clearly still do in Scotland and Wales, and non-Westminster elections in England), then the plurality system will probably continue to perform disproportionately and erratically, as it has in the past. |
| Change will only come when either Labour or the Tories agree to a new system, and the party involved forms part of a coalition commanding a Commons majority. It will probably need a referendum majority as well. | Westminster governments are likely to continue to be chosen by, and answer, to relatively smaller proportions of the population – especially older voters in ‘safe’ seats. |
| However, since the 2017 election UK opinion polls consistently show the top two parties dominating public support, and this is a pattern better suited to plurality rule elections – so that reform demands may decline (especially within Labour). | Trends evident before 2017, for younger people to vote much less and for sections of the population to reject election outcomes as unrepresentative, may be re-established in future, after being reversed in 2017. |
| An incremental change to adopt the supplementary vote (SV) system (used in London’s and other mayoral elections) could be implemented without a referendum, and might secure support from one of the top two parties. It would involve more voters in being able to choose their local MP and give each member a local majority of support. But it might well not improve proportionality. | Westminster’s legitimacy may continue at a low ebb, or decline compared with other UK governments and legislatures that are elected by more proportional voting systems and have stronger links to voters (as in Scotland, London and Wales). |
How ‘unfair’ or disproportional are Westminster elections?
Political scientists have developed systematic measures of how accurately voting systems translate popular votes into seats in the legislature. The simplest and most widely used measure is the ‘deviation from proportionality’ or DV score, which shows what proportion of seats have been ‘misallocated’ to parties that do not ‘deserve’ them in terms of their overall vote shares. To calculate it, we look at the individual deviations between the vote percentage and the seats percentage for all parties, as in this small example table (Figure 2).
Figure 2: A simple example of how to calculate the deviation from proportionality (DV) score
| Party | % votes | % seats | Deviations |
|---|---|---|---|
| A | 45 | 65 | 20 |
| B | 30 | 22 | -8 |
| C | 20 | 12 | -8 |
| D | 5 | 1 | -4 |
| Total | 100 | 100 |
Next add up the positive and negative numbers in the Deviations column, ignoring their signs, to get a number called the ‘modulus’ = 40.
To eliminate the double-counting involved in the modulus, divide by two, so DV score = 20
To set any DV score in context, bear in mind that almost any electoral system will end up somewhat over-representing larger parties at the expense of very small ones (such as those too small to win seats even under proportional representation). The smallest feasibly achievable DV score is normally around 5% (and not zero).
In the 2017 election, the big surges in support for Labour and the Conservatives produced a very close-fought election with historically very low levels of support for third or fourth parties in England (the dominant part of the UK). Yet neither of the top two parties emerged with a huge ‘bonus’ swathe of seats (as the winner would have done for most of the late twentieth century). Instead their seats were far more balanced than might have been expected, so that the DV score fell to a very unusually low level of just 9.3%. This number is somewhat misleading because disproportionalities that favoured the Conservatives in their dominant regions are offset by other deviations where Labour did well in its heartlands. If we look within each region the disproportionality levels are actually much higher. Nonetheless, the improvement from previous elections is a real one. So a critical issue now is whether the 2017 result is a one-off outcome. Is it likely to repeat in future, and become a new pattern – given that support for the top two parties also stayed high in national opinion polls in the year after the general election?
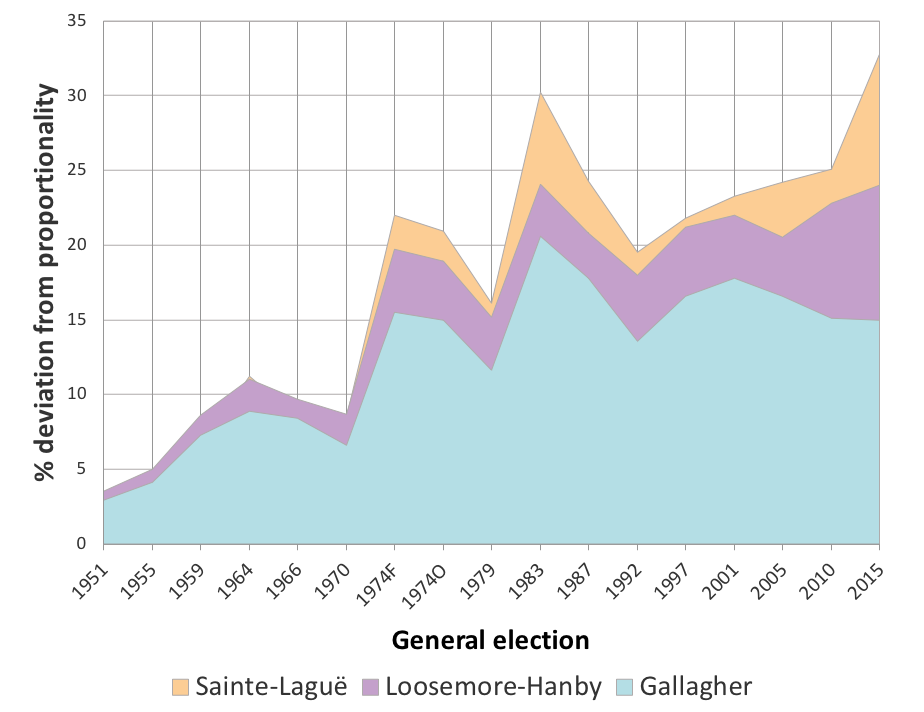
To see how exceptional the 2017 result is, consider how Westminster elections have performed on the DV measure over a longer period of time. Figure 3 below shows the DV score (also called the ‘Loosemore Hanby’ measure after its inventors) as the dark purple shaded area. The relationship between party vote shares and seats shares clearly waggled up and down a bit, but also became much more disproportional over time. The 2015 general election DV score reached a new high of 24% – so that almost a quarter of MPs in the Commons were not entitled to sit there in terms of their party’s share of the national vote.
Figure 3: How the disproportionality of Westminster elections grew over time, up to 2015
 Source: Computed from data in Renwick
Notes: The DV line here (in purple) shows the % of MPs elected to the Commons who are not entitled to be there from their party’s share of the vote – in other words how inaccurately votes are translated into seats. The practical minimum for any voting system is around 5%. For explanations of the other two lines, see the main text.
As with every aspect of political science measurement, there are also alternatives to the DV score. Figure 3 shows two main contenders, explained in more detail by Alan Renwick. Suffice to say here that the ‘Gallagher’ measure (shown light blue) is the most conservative index and arguably understates disproportionality by focusing only on the largest deviation. In 2015 this did not increase because the Liberal Democrat vote collapsed and UKIP (although almost unrepresented in MPs) had a smaller 14% vote share. The third measure, the ‘Sainte Lague’ (shown in yellow) is more orientated to the under-representation of smaller parties. It has been consistently above the DV score since 1974, and also shows the 2015 election as a post-war peak of disproportionality.
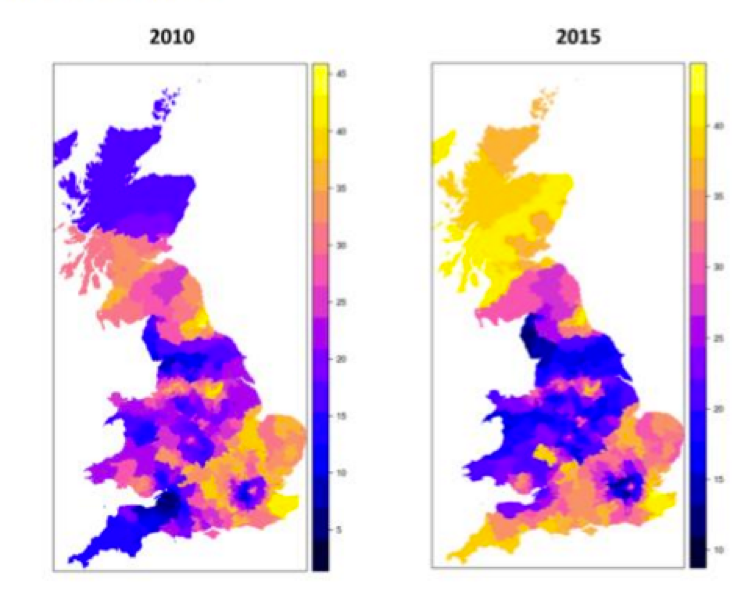
So far we have looked at national DV only, but in democratic terms what matters a lot also is how fairly elections seem to operate to citizens on the ground, in their own local area. When people support a particular party, how does their chosen party fare in winning seats in their surrounding area? We cannot compute DV for a single seat, of course, but we can look at the 20 seats nearest to every constituency across Great Britain and calculate the level of local DV that voters will experience in the area around them. Figure 4 shows the levels of deviation from proportionality that people experienced in the area around their constituency – with low scores shown purple and high scores yellow. They ranged very high in both 2010 and 2015, with some local DV scores at or above 40% in the worst cases, often far higher than the national DV numbers (which were 23% and 24% in these two years). Some areas were of course lower as well.
Figure 4: How much deviation from proportionality do voters experience in the local area ‘around them’?
 Source: Chris Hanretty
Note: The scale here shows the percent DV score in the 20 seats closest to each constituency in the country.
The side-by-side comparison in Figure 4 also shows how erratically plurality rule elections can operate from one year to the next. In 2010 with the Liberal Democrats riding high, south-west England was one of the most proportional regions (purple). But by 2015, with Liberal Democrat support plunging, and Labour’s vote growing but not enough to win seats, it was one of the most disproportionate regions (yellow). And in Scotland, the 2010 outcomes were disproportionate in the central lowlands with Labour as the key beneficiary, but more so by 2015 when the SNP was the sole beneficiary. However, there has been consistently bad disproportionality in Tory seats across southern and eastern England for decades, and also in Labour’s north-east stronghold. But local DV eased off a bit in 2015 in areas around some northern Labour cities and former industrial regions.
A third aspect of disproportionality involves recognising that nations differ a great deal in how their political parties and party system operate, with big implications for DV scores. So perhaps one of the best indicators to look at is how Westminster elections compare with other elections held under British political conditions, but using different electoral systems (discussed in detail in our Audit of the UK’s reformed electoral systems).
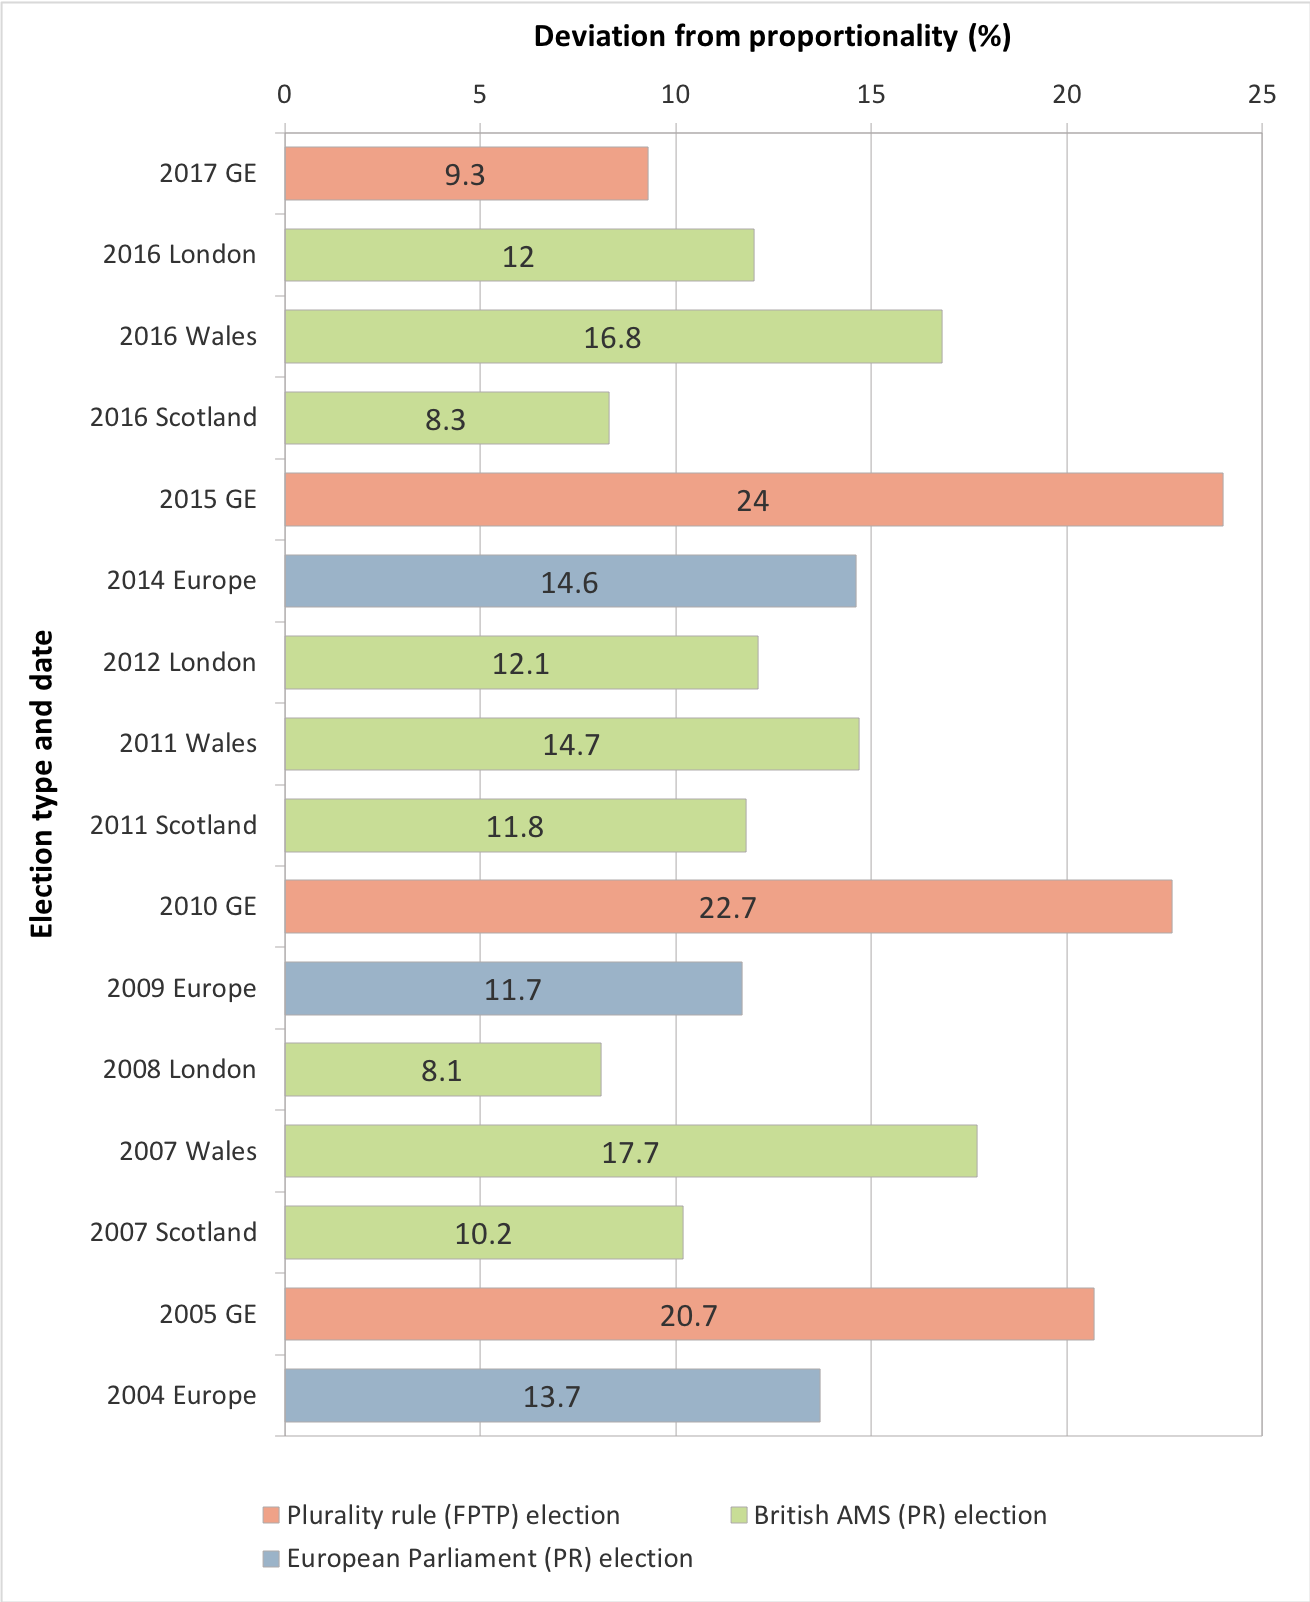
Figure 5 below shows that Westminster elections have been far more disproportional than all the other major electoral systems now used in the UK. For decades now over a fifth of MPs in the House of Commons have been for parties over-represented at other parties’ expense. In 2015 the Westminster DV score was a high 24%, only to fall back dramatically to 9%, less than two-fifths of this number in 2017. This is a perfectly respectable showing and the lowest Westminster DV score for decades. It reflects the renewed ascendency of the Conservatives and Labour, following the Liberal Democrat collapse in 2015 and UKIP’s demise in 2017, plus the fall back of SNP support in Scotland from its very high 2015 levels. With just two parties, plurality rule elections can produce quite proportional results. (For example, in the USA DV levels can be as low as 7–8% – because the Democrat and Republican parties still dominate all politics there.)
Figure 5: How disproportional have Westminster elections been over the last two decades, compared with other British elections?
Source: Patrick Dunleavy, GV311 lecture, LSE, 29 November 2017.
Note: The chart shows the % of MPs or representatives elected who are not entitled to their seats from their party’s overall share of the vote – in other words how inaccurately votes are translated into seats. The practical minimum for any voting system is around 5%.
The Scottish Parliament has consistently achieved DV scores under 11%, half the historic Westminster rate. And the Greater London Assembly is not much higher at 12.5%, despite having only 25 elected members (which makes fine-grain proportionality impossible to achieve). In Wales, the National Assembly’s Labour-designed electoral system has too few ‘top-up’ seats to give fully proportional outcomes, so the results there shows higher DV scores, over 14%, always in Labour’s favour.
Elections for the European Parliament are also shown in Figure 5, for the period 1999 to 2014 when they used a regional proportional representation system. Its accuracy was restricted by the small number of seats per region, so again this delivered only DV scores around 14% – but this was still two-thirds of the ‘normal’ Westminster levels in these decades.
In other respects, too, the UK after 2017 seems very far from American patterns, despite the Conservatives’ and Labour’s predominance in national opinion polls. In local elections the support for the Liberal Democrats has been consistently higher than their general election score, and the top two parties combined have commanded only 65 to 70% support in the 2017 and 2018 local elections, as Figure 6 shows.
Figure 6: the ‘national equivalent vote shares’ for the main parties in the 2017 and 2018 local elections
| Party | Vote share (%) in 2017 | Vote share (%) in 2018 |
|---|---|---|
| Conservatives | 38 | 35 |
| Labour | 27 | 35 |
| Liberal Democrats | 18 | 16 |
| All others | 17 | 14 |
| Total | 100 | 100 |
Source: BBC estimates re-balancing local election votes show what the ‘national equivalent’ vote share would have been. This controls for local voting taking place in different areas from year to year.
Conclusions
Overall, recent elections suggest that plurality rule has become more erratic in its operations. The 2015 election represented a new post-war high in the UK electoral system’s disproportionality, but the swing back to two-party pre-dominance in 2017 produced the UK’s best DV score for decades. Second, the levels of ‘unfairness’ experienced by voters at the local and regional level are much higher than the national figure suggests. For instance, in 2015 the SNP nearly won every single seat in Scotland, despite only winning 50% of the vote. Third, Westminster elections are historically far more disproportional than other kinds of British elections held using different voting systems.
In comparative terms, the historic record of the UK’s Westminster elections up to 2015 was almost five times more disproportional than the practicable minimum achievable in a modern electoral system. Plurality rule in the UK has consistently performed among the worst of any liberal democracies worldwide, until 2017’s shock result. And the voting system continues to operate in its familiar way in English and Welsh local elections, creating frequent large gaps between citizens’ votes and the party balance of their representatives. A central issue for the future must be whether the next general election will show a re-growth of Britain’s smaller parties and higher DV scores, rendering the 2017 result a blip (perhaps attributable to the special conditions of the disastrous 2017 Tory campaign)? Or whether instead the 2017 outcome marks a fundamental break point in party politics and electoral behaviours, which might produce long-run improvements in how the UK’s main voting system operates.
This is an extract from our 2018 book, The UK’s Changing Democracy: The 2018 Democratic Audit, published by LSE Press, which you can download for free here.
About the author
Patrick Dunleavy is Professor of Political Science and Public Policy at the LSE, and co-director of Democratic Audit.
Similar Posts
Subscribe
If you enjoyed this article, subscribe to receive more just like it.


 Democratic Audit's core funding is provided by the Joseph Rowntree Charitable Trust. Additional funding is provided by the London School of Economics.
[…] (DV) score below 5%, so we can regard this as a practicable floor for this measure. We noted in our Audit of the UK’s plurality system that DV scores for FPTP elections at Westminster historically averaged 22.5% between 1997 and 2015, […]
[…] 22.5% in the two decades up to 2015 – but which fell spectacularly to under 10% in 2017 (see our Audit on FPTP). Compared with the historic Westminster outcome Figure 2 below shows that the Scottish AMS system […]
Good to get to the nitty gritty of proportionality. Democracy cannot work without voters getting a fair representation.
But here are two arguments that better DV doesn’t always mean better democracy:
1. There were many reasons for the relatively low DV result from the 2017 general election. But from a voters viewpoint, there was a very high level of tactical voting (for the two main parties), following the sense of deep despair when votes for a smaller party were discounted in 2015.
2. “With just two parties, plurality rule elections can produce quite proportional results.” If we follow this argument, a DV score of zero can be achieved in a one party state!
Every one of us has their own set of beliefs, attitudes and opinions. For representative democracy to work, the more parties there are the more democratic it is. A two party state is nearly as undemocratic as a one party state. This is what we experience.
There’s an added undemocratic aspect to a two party state. When one party os governing and the other in opposition, their views and behaviour tend to be contradictory, oppositional and confrontational. This creates a culture medium for the worst form of populism – or classic in-group / out-group gang behaviour. We experience this and worse with Trump, Brexit, Russia and so on. Not democratic.