Why did the Conservatives’ large lead in vote shares produce only an 80-seat majority?
Plurality rule voting systems have a well-known tendency to exaggerate the seats of the largest party. A full analysis of the 2019 results remains to be completed, but Tim Smith finds evidence that this time around the Conservatives had a modest 23 seat advantage over Labour in terms of two-party bias. The ‘leader’s bias’ advantage was also much smaller than that which Labour enjoyed in 1997–2005. This may mean that the future boundary reforms to equalise constituency sizes may not be as beneficial as the Conservatives hope.
Picture: Andrew Parsons/ i-Images/Back Boris 2012 Campaign / (CC BY-ND 2.0) licence
Conservative politicians have long complained that they have been fighting the Labour party on an uneven pitch. Their case has been that Labour MPs have been elected in constituencies with smaller electorates than those in Conservative seats. The 2019 manifesto is the fourth Tory manifesto in a row to promise legislation to equalise the sizes of constituencies by implementing boundary reforms on a strict population basis. Once implemented, the pledge means that in future constituency sizes will not vary more than 5% from the UK quota (national average), with every set of boundaries reviewed every five years. The boundaries used in the 2019 election are now almost twenty years out of date. The electoral statistics used to draw them up derive from December 2000.
Some Conservative commentators have also noted that despite being just under 12 percentage points ahead of Labour in national vote share, Boris Johnson none the less gained a smaller majority of 80 seats in the Commons than when Labour won a majority of 165 in 2001 with just over a 9% lead. Table 1 below shows that Labour’s two-party lead in 2005 was under 3%, but it yet produced a two-party seats lead of 158 and an overall majority of 66. In 2019, the Tory lead was four times larger, but the two-party seats lead was almost the same as in 2005, and Johnson’s overall Commons majority is 80 seats.

The classic means of measuring two-party bias in a plurality rule (‘first-past-the- post’) system, is using Brookes’ decomposition method, as adapted by Johnston, Rossiter and Pattie, and also explained here. Everyone accepts that plurality rule benefits the larger parties, especially the winning party, at the expense of the smaller parties with widely spread support. The Brookes method has a more limited purpose, namely to check how level the playing field is between the top two parties. By adjusting the vote shares on a uniform basis to an equal level, one finds the Conservatives 23 seats ahead of Labour, which constitutes the total bias. The various components that go make up the overall bias can be derived algebraically using the Brookes method from this point.
Table 2 below shows that total bias in the system has been in the Conservatives’ favour since the 2015 election, when it peaked at a 49 seat lead advantage. Since then it dropped to 12 seats in 2017 (when Labour almost matched Tory support). In the 2019 election the Conservatives were well ahead in terms of votes, but the overall seats advantage they enjoyed rose only slightly to reach 23 at this election.
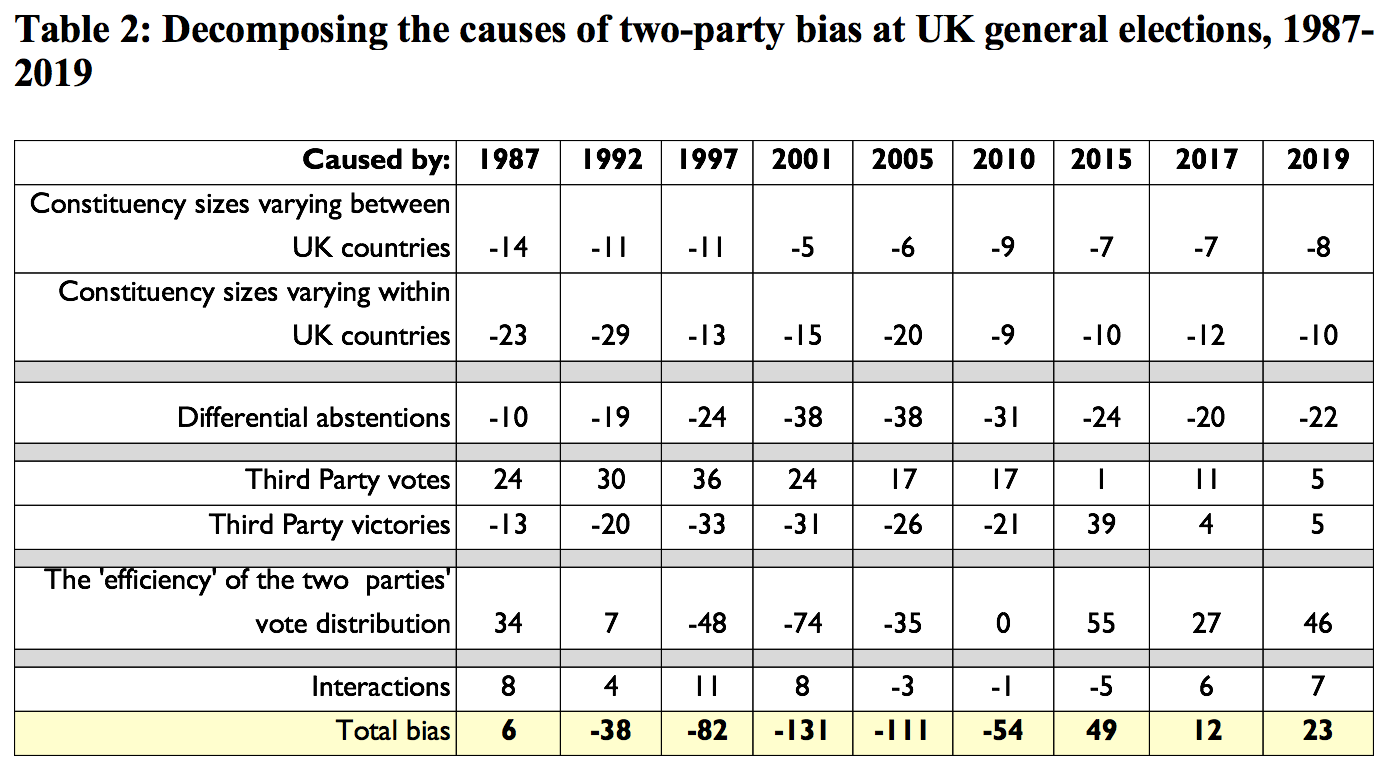
Sources: Data for 1987 to 2010 are drawn from here and here. Data for 2015–19 are the author’s calculations.
Notes: The cell entries show the consequences of bias in terms of two-party seat leads, i.e. multiplying each seat by 2. Positive numbers show a pro-Tory bias, and negative numbers a pro-Labour bias. Notice that the 2019 overall bias is much smaller than the leader’s bias Labour enjoyed in the three elections it won from 1997 to 2005. Indeed, Labour had a larger two-party bias in its favour in 2010, an election that it lost, than the Conservative gained in 2019 despite being streets ahead in voter terms.
Looking at the different components shown in Table 2 helps to explains why the very large lead the Conservatives received in terms of vote share did not translate into the kind of majority that Labour managed in 1997 and 2001. The size differentials between constituencies remains an issue, giving a Labour advantage over the Conservatives of 18 seats. Eight seats of this come from the differential between the three nations, England, Scotland, and Wales. Whilst Scotland’s representation was reduced closer to English levels in 2005 after devolution, there is a considerable malapportionment in the system favouring Wales. If constituency sizes were equalised in Wales, then the country would overwhelmingly elect Labour MPs on the basis of equal vote shares. This effect is currently constrained because Wales has much smaller constituency sizes than England, 58,000 to 74,900.
The other ten seats due to differentials in constituency sizes arise within a country, mainly within England. The Conservatives have tended to favour regular boundary reviews because in the past this seat bias in favour of Labour has grown between such reviews – inner city seats have tended to shrink whilst suburbs and rural seats have seen their electorates grow. However, this effect has not been the case this cycle. The size bias is exactly the same in 2019 as it was in 2010 when the current boundaries were first used. On the basis of actual voting shares (rather than the equal ones assumed by the Brookes method), the size bias has actually dropped since 2015, as the Conservatives have gained more support in territory with declining electorate sizes such as Stoke.
Differentials in turnout, or more properly lack of turnout, have had a greater impact on the two-party bias than differentials in constituency sizes. Throughout the period shown in Table 2, there has been a lower turnout in seats that are more Labour-inclined on average than those that are more Conservative-inclined on average. This effect peaked in 2001 and 2005 at a 38-seat bias to Labour and it has been 20 to 24 in the last three elections, larger than the impact of constituency size differentials. The average turnout in seats more Labour than the national average was 65.3%, compared to 69.3% in those seats more Conservative. Boundary changes will not assist the Conservatives here.
The ‘third party’ effects in Table 2 come from the minor parties either piling up ‘wasted’ votes in seats where they cannot win, or winning seats, in areas which are differentially more Conservative or more Labour. The net effects here have tended to favour Labour, with the Liberal Democrats historically winning more seats in areas which were more Conservative than Labour. However, after the Liberal Democrats’ big losses in 2015, and the SNP’s big gains in Scotland at that election, the third-party effect has moved towards benefiting the Conservatives, albeit only slightly. As John Curtice, has pointed out or here, this larger wedge of third party seats means that there is now a bigger landing zone for the UK’s voting system to produce hung Parliament outcomes, as it did in 2010 and 2017.
The main component in the system for the last three elections that has cancelled out the Labour advantage in terms of size and turnout, has been the Conservatives having a considerably more efficiently distributed vote. This comes from Tory votes being located in the right places across the country, so minimising ‘wasted surplus’ votes from piling up huge majorities in safe constituencies, and also minimising ‘redundant votes’, in seats where the party does not win. There was a big bias in Labour’s favour in 2005. The Conservatives have done well to turn this around to a bias in their favour of 55 seats over Labour in 2015. However, at the last two elections they have not been able to match the kind of advantage that Labour had in 2001 (74). The pro-Tory efficiency bias stood at 27 in 2017 and 46 seats in 2019. During the ‘New Labour’ era in 2001 and 2005, Labour made the most of local incumbency advantages and the party ruthlessly targeted and held onto marginal seats.
Some consequences
The Conservatives cannot necessarily assume that changing constituency boundaries on a stricter or more regular basis will help them buttress their majority as much as many appear to hope, or indeed as feared by some of the left. The much cited estimates that give the Tories a notional majority of 104 on ‘new’ boundaries are based on numbers for the 2018 review that was never implemented. That scheme is now unlikely to be put into action without significant change, since the electoral numbers on which it was based are now themselves dated (deriving from December 2015). Removing a more realistic two-thirds of the size bias would increase the current Tory majority a little bit, to 92 seats. But recent voting patterns also appear to be changing towards the Conservative Party doing better in northern towns. If so, then the strategy of putting though a strict boundary review every five years may not yield the kinds of gains that Tory party elites expect.
Both parties also appear to be looking at reforming the franchise in order to tilt the electorate in their favour. Labour has been proposing lowering the voting age to 16 and giving the vote at general elections to EU citizens, on the grounds that Commonwealth citizens already have this right. Surprisingly, the Conservatives have not moved to close off this unreciprocated anomaly, especially since it enfranchises large numbers of overseas students, who are eligible to vote immediately at general elections on arrival to the UK. These additional student votes almost certainly cost the Tories several university town constituencies, such as Canterbury and Warwick.
This article gives the views of the author, not the position of Democratic Audit. It was first published on LSE’s British Politics and Policy blog.
About the author

Tim Smith recently graduated with a PhD in Politics from Nottingham University. He works as a Senior Dealer for Ruffer LLP, but writes here in a personal capacity.
Similar Posts
Subscribe
If you enjoyed this article, subscribe to receive more just like it.


 Democratic Audit's core funding is provided by the Joseph Rowntree Charitable Trust. Additional funding is provided by the London School of Economics.