First-past-the-post – normal (disproportionate) service has resumed
In the 2017 election the UK’s ‘first-past-the-post’ electoral system operated quite proportionately, as the Conservatives and Labour level-pegged at high levels of support, and squeezed out support for other parties. In 2019, however, FPTP reverted most of the way back to its historic pattern, awarding a huge ‘leader’s bonus’ of seats to the Conservatives in England and to the SNP in Scotland. Patrick Dunleavy explores why the levels of disproportionality have bounced back towards historic levels.

Seats by party in the 2019 House of Commons. Picture Karumu kun/CC BY-SA 4.0 licence
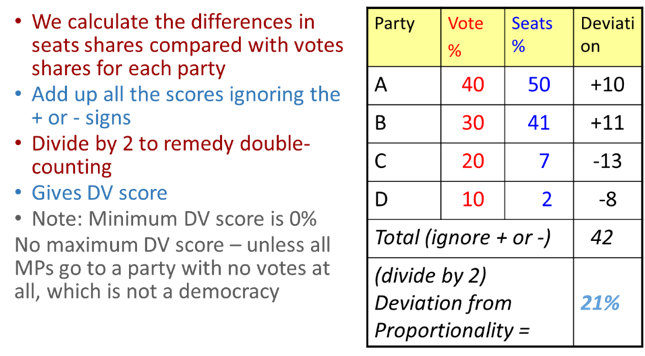
No electoral system in the world is completely proportional. The key measure of disproportionality used by political scientists is called ‘deviation from proportionality’ (or the DV score for short). It is calculated by working out the % of votes and the % of seats that each party got, and then subtracting % votes from % seats to give ‘deviations’ between them. A positive deviation shows that the electoral system has over-represented a party in the legislature relative to its national share of the vote. Negative deviations show that a party was left under-represented against its vote share. We then add up all parties’ positive or negative deviations, ignoring the plus or minus signs (which double counts), and then divide by two to get the DV score. We can think of this measure as showing the proportion of members of a legislature who are not entitled to be there in terms of their party’s national vote share. Table 1 below shows a simplified example of how the DV score can be calculated.
Table 1: A simplified view of how to calculate the ‘deviation from proportionality’ score
Like most good indices, the DV score’s theoretical minimum level is 0%. In practice, however, the minimum score that can be attained under practical conditions is not 0%, but something much more like 4 or 5%. This is due to various technical reasons – such as the likelihood that tiny parties will not secure any seats under any conceivable electoral system; the fact that the constituency system may not distribute seats exactly by population; and the near-certainty that voter turnout levels will also vary across seats.
What is the maximum level of DV score? You might suppose that it was 100%, but it is actually much, much lower, depending on the outcome of the election itself. A 100% DV score would occur only if all the seats in a legislature went to a party that had no popular votes at all – which of course is not within the range of liberal democratic outcomes at all. The best measure of the maximum DV score for a given election is 100% minus the vote share of the largest party. This is because an extreme case of an unrepresentative voting system that could still just claim to be democratic is one where the largest party wins all the seats, whatever its vote share. We can measure how far a political system comes to being this kind of limiting case for a liberal democracy by seeing how far it gets towards this contextual maximum DV score. In the 2015 general election in Scotland, for instance, the SNP won 50% of votes and 56 out of 59 Scottish seats, that is 95% of seats. So here the actual DV score was 45% and the maximum just-democratic DV score would be 50 (100-50 = 50). So, in 2015 the Scotland general election DV score was 90% of the way (45/50) to not being a liberal democracy outcome at all. (Helen Margetts and I coined the term Alternative Deviation from Proportionality (ADV) for this measure.)
Britain’s DV score record
Not a lot of people are aware that if only two parties compete with each other, then national DV scores levels under ‘first-past-the-post’ (more strictly ‘plurality rule’ elections) can operate very proportionately. In the USA, for instance, DV scores of around 7% occur regularly, which is very close to the feasible minimum, because the vast majority of voters support either the Republicans or Democrats.
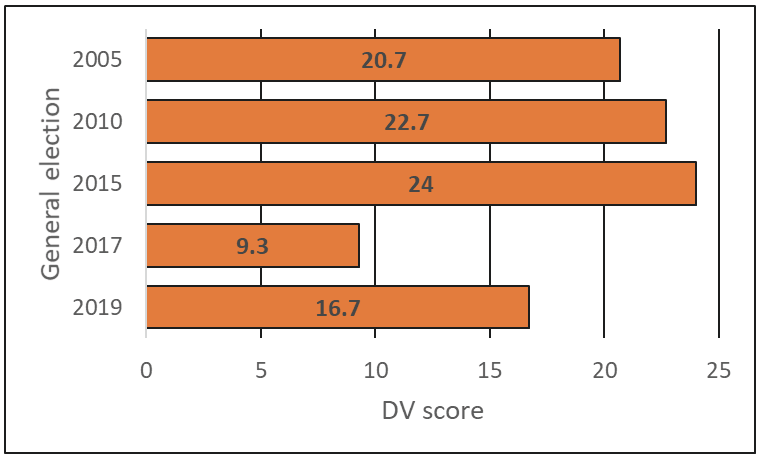
As Britain has been a multi-party system since the February 1974 general election, however, the outcomes here have historically been three times the US level of disproportionality, and far higher than most others in Europe. As Figure 1 shows, the UK’s DV score levels were mostly above 20% in recent decades, a record that stretches back to the 1980s triumphs of Margaret Thatcher.
But in 2017 the UK’s DV score level plunged to just 9.3%. As the figure shows, this was less than half the usual around 20%+ levels of DV scores for earlier elections in 2005, 2010 and 2015.
Figure 1: The deviation from proportionality scores in UK general elections 2005–2019
The big influence on DV scores in the UK system is simply the size of the national vote share going to parties to which the UK electoral system awards no or very few seats because they rarely come top in any given local area. For example, in the 2015 general election UKIP (then lead by Nigel Farage) racked up 13% of the national vote in Great Britain and won just a single seat. In the same election voters punished the Liberal Democrats for their (suicidal) part in the austerity policies of the Cameron-Clegg coalition government, giving them just 7% of the vote. Competing against a Conservative party whose vote was five times as large nationally meant that the Liberal Democrats won just 8 seats – resulting in a total DV score of 24. The 2017 improvement in the DV score reflected the fact that UKIP virtually disappeared from the scene, the Liberal Democrats flat-lined at their lowest score and the top two parties in England, Wales and Scotland garnered at least five-sixths of all the votes.
The 2019 result
So what happened this time? Figure 1 above shows that the DV score bounced back to high levels, and Table 2 below tells the detailed story (using the most up-to-date information available for Britain at the time of writing). The Conservatives received a massive ‘leader’s bonus’ of 13%, beyond what they are entitled to in terms of their 45% share of the vote. If we look at England alone the Conservatives won 65% of seats for 45% of the votes, yielding a DV score of 17.5. Since using the Alternative DV (ADV) score explained above, this actually translates to a score of 30.1%, showing that FPTP in Great Britain as a whole was three-tenths of the way to not being a liberal democratic voting system at all.
Even more favoured by the electoral system were the Scottish National Party, who got 7.6% of GB seats for 4% of the vote. If we focus just on the Scottish election, the SNP got 82% of the seats for 45% of the votes. This yields a Scotland DV score of 37% (that is, more than a third of seats available were ‘unearned’ in popular vote terms). And in ADV terms (explained above) this puts the Scottish outcome in 2019 two-thirds of the way along to being maximally unrepresentative while still being a liberal democracy.
Table 2: The deviation from proportionality (DV) score for the 2019 general election in Great Britain
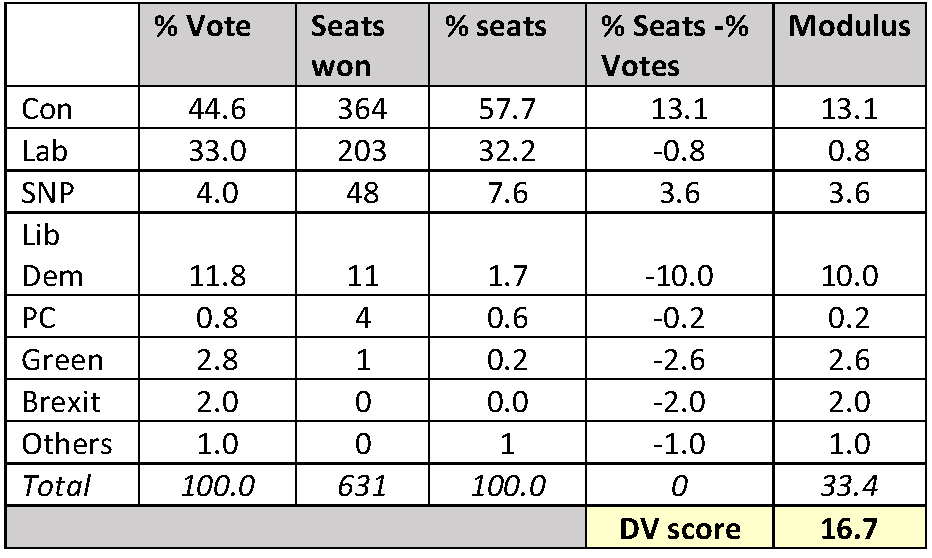
Again, the big losers in 2019 were the Liberal Democrats who got just over two handfuls of seats for their 3.7 million votes nationally, and the Green Party, who retained one seat, and Brexit Party who got no seats at all. Altogether 5.6 million people supported parties that either won no seats or were severely under-represented. Only the Liberal Democrats’ disastrously flawed campaign, the late squeeze of Liberal Democrat vote share by Labour, and Farage’s bizarre decision not to stand against Tory sitting MPs (which largely collapsed his Brexit Party’s vote share) kept the DV score from returning all the way to its historic level above 20%.
Thus, first-past-the-post elections did what they will always do in a multi-party system, favouring parties with spatially concentrated vote shares, and discriminating massively against those whose support is spread more evenly across the country. We can thus see 2017 for the disproportionality blip it was. Normal service has been resumed.
About the author

Patrick Dunleavy is Professor of Political Science and Public Policy in the Government Department at LSE, and Centenary Professor at the Institute for Governance and Policy Analysis at the University of Canberra. His most recent books are The UK’s Changing Democracy (LSE Press, 2018) [co-edited], which is free to download; The Impact of the Social Sciences (Sage, 2014) [co-authored]; and Growing the Productivity of Government Services (Elgar, 2013) [co-authored]. His Twitter account is @PJDunleavy.
Similar Posts
Subscribe
If you enjoyed this article, subscribe to receive more just like it.


 Democratic Audit's core funding is provided by the Joseph Rowntree Charitable Trust. Additional funding is provided by the London School of Economics.