Was the 2015 election the most disproportional ever? It depends how you measure it
The 2015 election has been described as both one of the most disproportional elections ever and one of the least. Alan Renwick discusses the notion of electoral disproportionality and weighs up the relative merits of the different indexes that have been developed to measure it.

In a report published earlier this month, the Electoral Reform Society declares the 2015 general election ‘the most disproportional election to date in the UK’. The ERS’s website cranks up the rhetoric further: ‘It’s official: this election was the most disproportionate in UK history.’ In marked contrast, my own first cut at analysing the election results, published a few weeks earlier, said that this was not the UK’s most disproportional election: that, indeed, it was the least disproportional since 1992.
So what is going on here? Which of us is right?
The simple answer to the first of those questions is that we have used different methods to measure proportionality. The simple answer to the second question is that there is no simple answer: it very much depends on what you mean by disproportionality.
What is electoral disproportionality?
Let’s start with the basics. A perfectly proportional election is one in which every party wins seats in exact proportion to its share of the votes. So a party with 45 per cent of the votes wins 45 per cent of the seats, a party with 5 per cent of the votes wins 5 per cent of the seats, and so on.
Disproportionality refers to the degree to which the actual result deviates from this ideal. To compare levels of disproportionality across elections, we need a way of measuring it. The difficulty is that there are many ways of measuring it. And which one is best is far from clear.
The table below shows the level of disproportionality at recent elections using three different measures. The first – the Loosemore-Hanby index – is the one used by the Electoral Reform Society. The second – the Gallagher index – is what I used for my initial calculations. The third – the Sainte-Laguë index – is not widely known, but I will argue that it does a better job of capturing our intuitions about disproportionality than either of the alternatives.
Three measures of electoral disproportionality
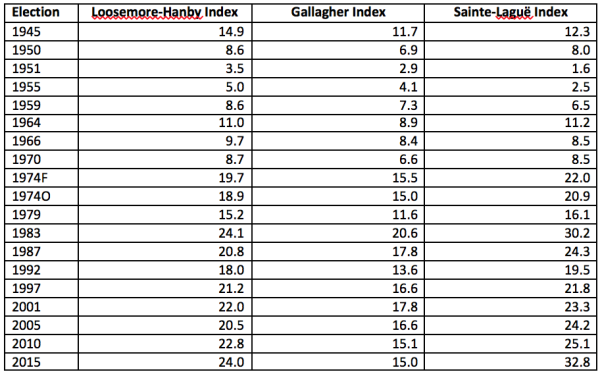
Sources: Calculated by the author from data in Dieter Nohlen and Philip Stöver (eds.), Elections in Europe: A Data Handbook (Baden-Baden: Nomos, 2010) and the websites of UK Political Info and the Electoral Commission.
For all three indices, a higher number means greater disproportionality. Whichever index we use, it is clear that elections from 1950 to 1970 were notably proportional. Then there was a sharp rise in disproportionality in the election of February 1974 – coinciding with the beginning of the breakdown of the post-war Conservative–Labour duopoly. Disproportionality has remained high ever since.
But just how disproportionality has changed over the last forty years varies from index to index. For Loosemore-Hanby, two elections – those of 1983 and 2015 – more or less tie for the title of most disproportional. For Gallagher, 2015 was only the eighth most disproportional election. Of the eleven elections since February 1974, only two have been clearly less disproportional. Finally, for Sainte-Laguë, the 2015 election comes out in clear first place in terms of disproportionality: it beats even the election of 1983, when the SDP–Liberal Alliance secured 3.5 per cent of the seats on 25.4 per cent of the votes while Labour won 32.2 per cent of the seats on 27.6 per cent of the votes.
Which measure is best?
So which of these measures should we prefer? Readers who would like a detailed discussion of this point can go to a longer version of this post in which I explore the properties of the various indices at some length. What matters here is that the three measures get at different underlying notions of proportionality.
The Loosemore-Hanby index is the simplest and oldest. It looks at the deviation between each party’s vote share and its seat share: if a party obtains, say 25 per cent of the votes and 20 per cent of the seats, the deviation is 5. The index adds up these deviations across all the parties and divides the total by two.
This measure has a nice intuitive meaning: it represents the total over- or under-representation in Parliament. In 2015, for example, the value of the index is 24.0. That means that the parties whose seat shares exceed their vote shares (the Conservatives, Labour, the SNP, the DUP, and – fractionally – Sinn Féin and the SDLP) collectively hold 24 per cent of the seats in the House of Commons more than they would if they were represented in exact proportion to their votes – that is, about 156 seats more. Conversely, the under-represented parties (UKIP, the Liberal Democrats, the Greens, and other smaller parties) collectively hold about 156 seats fewer than they would in the case of perfect proportionality.
Most political scientists, however, prefer the Gallagher index over the Loosemore-Hanby index. There are several reasons for this, but probably the most important is a concern that Loosemore-Hanby gives the same weight to a large number of tiny vote–seat deviations as to a small number of larger deviations. The Gallagher index overcomes this by giving greater weight to larger deviations (those who want the full details can seek them out in the longer post).
These indices might seem perfectly reasonable at first blush. But consider two of the most striking results in the last two general elections. In 2010, the Liberal Democrats secured 8.8 per cent of the seats from 23.0 per cent of the votes. In 2015, UKIP won just 0.15 per cent of the seats from 12.6 per cent of the votes. Which of these is the more strikingly disproportional result? Whether we use Loosemore-Hanby or Gallagher, the answer is that the Lib Dems in 2010 suffered the greater under-representation: their vote–seat gap, at 14.3 per cent, was greater than UKIP’s, at 12.5.
But many people (disregarding any feelings they might have for or against either party) seem more troubled by the UKIP result: the Liberal Democrats might have been under-represented in 2010, but they did at least secure 38.1 per cent of their proportional share of the seats; UKIP in 2015, by contrast, won just 1.2 per cent of its proportional share. When I did a quick – entirely unscientific – test of opinion among my Facebook friends in the process of preparing this post, the substantial majority (though not all) of those who responded came back with the view that a UKIP-type result was more “unfair” than a Lib Dem-type result (I say “type” here because I actually made the numbers a bit less extreme in order to make the test harder).
The intuition here seems to be that what matters is not the absolute deviation of seat shares from vote shares – the starting point of both Loosemore-Hanby and Gallagher – but rather the relative deviation: the deviation in proportion to the party’s support. To take a further example, Loosemore-Hanby and Gallagher both see as much disproportionality if a party with 30 per cent of the vote gets 25 per cent of the seats as if a party with 5.1 per cent of the vote win 0.1 per cent of the seats. Most people find that odd.
The Sainte-Laguë index captures this intuition by looking at vote–seat deviations in proportion to each party’s size. Again, readers wanting the details of how it does this can refer to the longer version of this post.
Size is relative
It seems to me that, in fact, if we are concerned about disproportionality in itself, then only a relative measure can do. We think of something as “big” or “small” in relation to the size we would expect it to have: a big mouse would be a very small human being. So with vote–seat deviations, whether a given gap is big or small depends on how big the party is. The Sainte-Laguë index – though rarely used – seems to me therefore to be the best embodiment of what we think of as disproportionality in itself. It measures the degree to which an election outcome over- or under-represents particular parties and their voters.
The Loosemore-Hanby and Gallagher indices, by contrast, seem to be getting more at how electoral disproportionalities affect governance after the election: for this, it seems reasonable to argue that vote–seat deviations unadjusted for party size are likely to matter more. In particular, they give more weight than does Sainte-Laguë to the over-representation of the largest party, which often generates a majority of seats for one party in UK elections. They do this in slightly different ways to each other, and they both do it imperfectly: indeed, trying to capture how disproportionalities influence the next several years of government in a single index seems to me like trying to do much more than any single index can do. Nevertheless, they probably do it a bit better than does Sainte-Laguë.
Where does that leave us?
My impression, therefore, is that, if we want simply to measure disproportionality in itself, we should go for Sainte-Laguë. On this basis, the Electoral Reform Society is right and I was wrong: the 2015 election was indeed the most disproportional in the UK since 1945 (though not for the reasons the ERS had in mind). There might be grounds for preferring Loosemore-Hanby or Gallagher for some purposes. As a measure of proportionality as such, however, Sainte-Laguë looks best.
This is, however, a tentative conclusion: as I said, the Gallagher index is currently dominant in political science, while Sainte-Laguë, so far as I can tell, is never used. If there is a good reason for this, please let me know! I shall be willing to change my view.
—
This post originally appeared on the Constitution Unit blog and is reposted with permission. It represents the views of the author and not those of Democratic Audit or the LSE. Please read our comments policy before posting.
For those interested in the more technical aspects of this discussion, a more detailed version of this post is available on the Politics at Reading blog.
—
 Alan Renwick is Reader in Comparative Politics at the University of Reading and is due to join the Constitution Unit in September as Deputy Director (details here).
Similar Posts
Subscribe
If you enjoyed this article, subscribe to receive more just like it.


 Democratic Audit's core funding is provided by the Joseph Rowntree Charitable Trust. Additional funding is provided by the London School of Economics.
In @thegloballab, @CullinaneCarl said #GE2015 among most disproportional. What did he mean? @alanjrenwick explains: https://t.co/Ls5FsZjNZL
How disproportional was the 2015 General Election? Alan Renwick answers: https://t.co/uXAsrlx1u2
[…] So what do the findings tell us? Here are some initial thoughts: Election 2015 – BBC News. Did the Tories really win? Was the 2015 election the most disproportional ever? It depends how you measure it. […]
https://t.co/p8CQv9Taes Democratic deficit in the UK clearly a problem. Will Labour actually do something about it in the near future?
Tories have disproportionate power: https://t.co/8uF5lc8Mys
Was the 2015 election the most disproportional ever? It depends how you measure it: The 2015 election has been… https://t.co/V3b8FHS9XT
Was the 2015 election the most disproportional ever? It depends how you measure it https://t.co/Ib94TSsjfP #Option2Spoil
Was the 2015 election the most disproportional ever? It depends how you measure it https://t.co/aeKllLtzDF https://t.co/74zkBTQPlB