How democratic is the UK’s proportional electoral system: the single transferable vote (STV)?
Patrick Dunleavy examines the proportional (PR) electoral system now used for smaller UK elections: the Northern Ireland Assembly, and Scottish and Northern Irish local councils. How has STV fared in converting votes into seats and fostering political legitimacy, under British political conditions? An Annex also discusses the list PR system used to elect European Parliament MEPs from 1999 to 2014, but now discontinued as a result of Brexit.
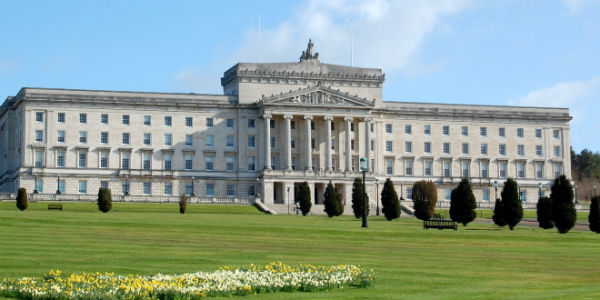 Stormont, the Northern Ireland Assembly. Picture: Dave Sanford via a (CC BY-NC 2.0) licence
What does democracy require for an electoral system?
- It should accurately translate parties’ votes into seats in the legislature (here, local councils in Scotland and Northern Ireland, plus the Northern Ireland Assembly),
- Votes should be translated into seats in a way that is recognised as legitimate by most citizens (ideally almost all of them).
- No substantial part of the population should regard the result as illegitimate, nor suffer a consistent bias of the system ‘working against them’.
- If possible, the system should have beneficial effects for the good governance of the country.
- If possible, the voting system should enhance the social representativeness of the legislature, and encourage high levels of voting across all types of citizens.
Used for: Electing local councillors across Scotland and Northern Ireland; and for choosing members of the Northern Ireland Assembly. Elsewhere in the world, single transferable vote (STV) is only used to elect parliaments in Ireland and Malta, and for Australian Senate elections.
How it works: All representatives are elected in larger constituencies that have multiple seats (usually between three and six). STV seeks to allocate seats to parties in direct relation to their vote shares, so as to end up with minimum possible differences between their seat shares and vote shares (‘high proportionality’). Within each multi-seat constituency, parties put up multiple candidates (up to as many as there are seats). Voters mark their preferences across parties, and within parties across candidates, using numbers (1, 2, 3 etc.). Voters therefore have the option to support candidates from across different parties, so as to match exactly their personal preferences. A complex counting process then operates that allocates seats in order to the candidates that have the most votes, to achieve the best overall fit possible between party vote shares and their number of legislators.
The total number of votes cast is divided by the number of seats being contested plus one. This gives a ‘quota’, or a vote share that guarantees a party one seat. (For example, if 100,000 people have voted, and we have 4 seats to elect in a constituency, then the quota would be 100,000 divided by [4+1] = 20,000 votes.) Any candidate with more than a quota (so 20,001 and upwards) gets a seat straightaway. Every time a seat is allocated, we deduct one quota share of votes from the total remaining, and any surplus votes of the elected candidate are redistributed to their voters’ second or next choices.
Once this has been fully done, if there are still one or two seats not yet allocated, a different method is used to knock out candidates from the bottom. The least popular candidate is eliminated from the race, and their voters’ second or next preferences are redistributed across the candidates still in the race. This is repeated until one of the parties still in the race has enough votes for a quota and so wins the next seat. We then deduct this quota from the total votes (as above) and carry on with the ‘knocking out the bottom candidate’ process until all the seats are allocated (the final seats can sometimes be filled by candidates who do not reach the quota, if they have the highest number of votes after all transfers have been made).
Recent developments in Northern Ireland
The single transferable vote was first introduced into the UK because of sectarian conflicts between the Protestant and Catholic communities in Northern Ireland during the period 1968–2008. STV was part of the original arrangements for the Northern Ireland parliament in 1921, and when power-sharing was established it was viewed as desirable because it had operated successfully for many years in southern Ireland. It is a transparently ‘fair’ system – matching parties’ seats in direct relation to their votes, unlike the large distortions possible with plurality rule voting (retained in Northern Ireland only for Westminster elections).
Because STV also lets voters choose to support candidates they like across party lines, British leaders hoped that the system would encourage Northern Ireland voters to endorse ‘moderate’ people rather than sectarian extremists, and to support newer parties (like the Alliance) that were non-sectarian. By and large these earnestly hoped-for effects did not materialise. The moderate Protestant party, the Ulster Unionists (UUP), lost ground gradually, to be displaced by the initially more vigorously Protestant party, the Democratic Unionist Party (DUP). Sinn Féin, the more radical Catholic-backed party with links to the IRA tradition, gained ground, while votes for the more ‘moderate’ Social Democratic and Labour Party (SDLP) declined over time. The Alliance and other cross-sectarian parties survived under STV, but their vote share remained small, and ‘cross-voting’ across sectarian lines has been relatively rare.
Still the STV elections for the 108 seats Northern Ireland Assembly (reduced to 90 in 2017) were successful for a long time in helping to create impetus for a development towards peaceful coexistence between communities (and a degree of co-sovereignty of the UK and Irish Republic) in Northern Ireland. The accurate seats shares were also important in constituting the power-sharing Northern Ireland executive in a proportional way in the period from 1998 to January 2017. When this was operating, the party with most seats got the first pick of ministerial positions, the party with the second most seats got the second pick, and so on. This system collapsed in January 2017 over a political corruption scandal and the Executive and Assembly remain suspended at the time of writing.
STV also applies to all Northern Ireland local elections. It initially operated in 26 districts (whose boundaries slightly favoured the DUP). In 2014 the first elections took place on new boundaries for the 11 larger and modernised districts, stimulating a flurry of candidacies that increased the proportion of votes going to small candidates or parties, and so somewhat boosted disproportionality.
Especially since the transition to power-sharing, and perhaps even more since the suspension of the Executive, local councils have played an important role in the political life of Northern Ireland. STV elections have helped to somewhat moderate previous sectarian elements in municipal government over the long term, especially in equalising service provision, although controversies over flags and other sectarian symbols sometimes recur.
Recent developments in Scotland
STV elections spread to mainland Great Britain in 2006, when the Labour–Liberal Democrat coalition in the Scottish Parliament introduced the reformed voting system for the country’s local authorities. The Liberal Democrats have been long-time advocates of STV as the most proportional voting system. The SNP accepted the reform, but were not that interested at first – ironically for it later proved to be crucial for them in opening up entrenched Labour municipal strongholds for their councillors. Even though STV requires very much larger council wards (in order to elect multiple councillors), and some of these wards in low-population parts of the Highlands proved to be vast areas indeed, the radical change went through.
The first Scottish local government elections using STV took place in 2007. Many voters were confused then because the AMS elections for the Scottish Parliament and the STV elections for councils were held simultaneously (which Labour felt would maximise their chances). On a high turnout of 53%, Labour and the SNP were neck and neck in terms of votes, with Labour slightly ahead despite losing 4% of its vote share. The seats allocations placed the SNP ahead, however, and the party made major advances in its local visibility.
The second set of Scottish STV elections were held in May 2012, and with no Scottish Parliament elections on the same day turnout fell to 40%. The SNP and Labour were again close in the lead in popular vote terms, and both gained seats, often from the Liberal Democrats (unpopular because of their Westminster coalition with the Tories). The results were highly proportional, with the SNP, Independents and Labour somewhat over-represented at a national level, and the Conservatives, Liberal Democrats and Greens somewhat under-represented. But these effects were very small-scale.
The two STV results helped to fuel the SNP’s build-up of its party machine, with its many new councillors since 2007 playing leading roles in the party’s 2014 referendum campaign on leaving the UK. Labour’s local party machine went into something of decline for a time, without large numbers of erstwhile councillor-activists to sustain it, setting the scene for the party’s wipe-out losses to the SNP at the 2015 Westminster general election.
The 2017 STV elections were held a month before the Corbyn surge at the general election, with a higher 47% turnout. The SNP votes and seats stayed steady, but there was a 12 percentage point surge of Conservative support at Labour’s expense. Labour lost another third of its Scottish council seats, while the ascendant Conservatives under Ruth Davidson gained 146% more seats, and moved into second place in terms of councillor numbers.
Strengths, Weaknesses, Opportunities, Threats (SWOT) analysis
| Current strengths | Current weaknesses |
|---|---|
| STV is a clearly proportional voting system when operating in UK conditions, and mostly works very well to match party seats and votes. | Even with large multi-member constituencies, some smaller constituencies may rather randomly not represent all parties (for example, a three- or four-seat constituency in a five-party system). |
| In theory it offers voters the chance to move popular candidates up their party’s rank order) potentially shaping who gets elected, (and perhaps move down unpopular candidates that parties have ranked high). In practice, most voters follow party rank orderings. | The counting process in STV is complex and hard to explain to citizens, potentially endangering its legitimacy. |
| STV does not necessarily promote diversity. For example, the proportion of women councillors in Scotland was a low 22% in 2007. It grew only a little to 24% in 2012 and 29% in 2017. | |
| In Northern Ireland STV has not had as much impact as UK elites hoped in encouraging voting across sectarian dividing lines. |
| Future opportunities | Future threats |
|---|---|
| The STV system seems well-established, and its results are well accepted. | Turnout in the Northern Ireland Assembly elections declined from 70% in 1998 to 54% in 2011 and 2016. |
| In Scotland local election turnout was 40% in 2012, but rose to 47% in 2017, good for local council contests. Questions around whether the more complex electoral system deters voters that arose in 2007 and 2012 have receded. As citizens become more familiar with voting using STV there is the potential for it to be used more widely for other UK elections. |
How proportional is the single transferable vote in UK conditions?
In almost any voting system it is hard indeed to get the deviation from proportionality (DV) score below 5%, so we can regard this as a practicable floor for this measure. We noted in our Audit of the UK’s plurality system that DV scores for FPTP elections at Westminster historically averaged 22.5% between 1997 and 2015, until 2017 when they fell radically to 9.3%. Figure 1 below shows that both the Northern Ireland Assembly and the Scottish system have performed about three times as well as Westminster elections. In fact, the Scottish result in 2017 is almost as low as it is feasible to get, and other scores are consistently close. The Northern Ireland council result in 2014 was considerably less proportional, however, under the new local government boundaries. This largely reflected the poor success of a flurry of small parties and independents. In that year they garnered nearly one in eight votes in all, but this total was fragmented across many candidates and so was often insufficient to win seats.
Figure 1: The deviation from proportionality (DV) scores in recent STV elections in Scotland and Northern Ireland
| Date | Election | National DV scores % |
|---|---|---|
| 2017 | Scottish local councils | 5.9 |
| 2017 | Northern Ireland Assembly | 3.9 |
| 2016 | Northern Ireland Assembly | 4.1 |
| 2014 | Northern Ireland councils | 11.1 |
| 2012 | Scottish local government | 7.5 |
| 2011 | Northern Ireland Assembly | 6.5 |
| 2011 | Northern Ireland councils | 4.5 |
| 2007 | Scottish local councils | 7.5 |
Conclusions
The adoption of STV in the UK has shown that PR can work effectively under the UK’s political conditions, and that it is undoubtedly reliably proportional. That said, it is not without some weaknesses, such as tending to favour larger parties in multi-party systems, for example at the expense of the Liberal Democrats and Greens in Scotland. And STV elections using numbered votes cannot easily be held on the same day as elections using X voting, as the first Scottish local government elections showed in 2007. But otherwise Scottish and Northern Irish voters seem to have coped well with ranking their choices and accepting the fairness of STV’s complicated counting process. The survival (indeed flourishing) of independent councillors in Scotland (despite perhaps overly small STV constituencies there) also suggests that voters can use their preferences across parties as intended.
The Liberal Democrats have long supported using STV for all UK elections, as has a well-funded NGO, the Electoral Reform Society, which has propagandised for the system for more than 120 years. However, Conservatives and Labour both resist the system (suspecting that it will favour the Liberal Democrats in England). Add in the fact that the electorate voted against electoral reform in the 2011 referendum, and the use of STV is unlikely to be expanded in the foreseeable future.
Annex: The list proportional representation system for electing the UK’s MEPs, used from 1999 to 2014
In addition to STV, the UK operated a PR system for elected Members of the European Parliament, from 1999 to 2014, but this sequence came to an end with the 2016 Brexit referendum for Leave. The UK will not participate in the July 2019 European Parliament elections, nor in any future such elections. However, the experience of these elections is still relevant for understanding UK politics and electoral reform.
Was used for: choosing the 70 British members of the European Parliament (MEPs); the three Northern Irish MEPs were elected via STV.
How it worked: The country was divided into 12 regions, ranging in size from the South East (ten seats) and London (eight seats) down to the North East and Northern Ireland (three seats each). The main parties all selected enough candidates to contest all of a region’s seats, while smaller parties could only contest some of the available seats. The parties arranged their candidates on their list, so candidates that are placed at the top would win seats first if their parties get enough support. The ballot paper showed each party’s list and voters chose just one party to support using a single X vote.
All the votes in each region were then counted and each party got seats in proportion to the party’s vote share. So, suppose we had a region with ten seats where party A got 40% of the vote – they should end up with four of the available seats. This system is very proportional but it may favour larger parties if votes are heavily fragmented across many smaller parties. List PR is also used widely across Europe for electing national parliaments, as well as the European Parliament (EP).
Historic developments
The List PR system was first introduced in 1999 as a result of twin pressures – from the EU to put in place more standardised PR elections for the European Parliament; and a ‘constitutional pact’ between Labour and the Liberal Democrats, signed just before the 1997 general election. The scheme was drawn up by the UK civil service for 86 seats using standard regions as multi-seat constituencies.
In 2004, 2009 and 2014 EP elections took place one year before general elections. In all these years, support for the UK Independence Party (UKIP) surged and that for the Conservatives and Labour took a big hit. And because this was a PR system, UKIP’s large vote shares converted into seats well, especially in 2014.
Figure 2: The largest party in the 2014 European Parliament elections, by local authority area
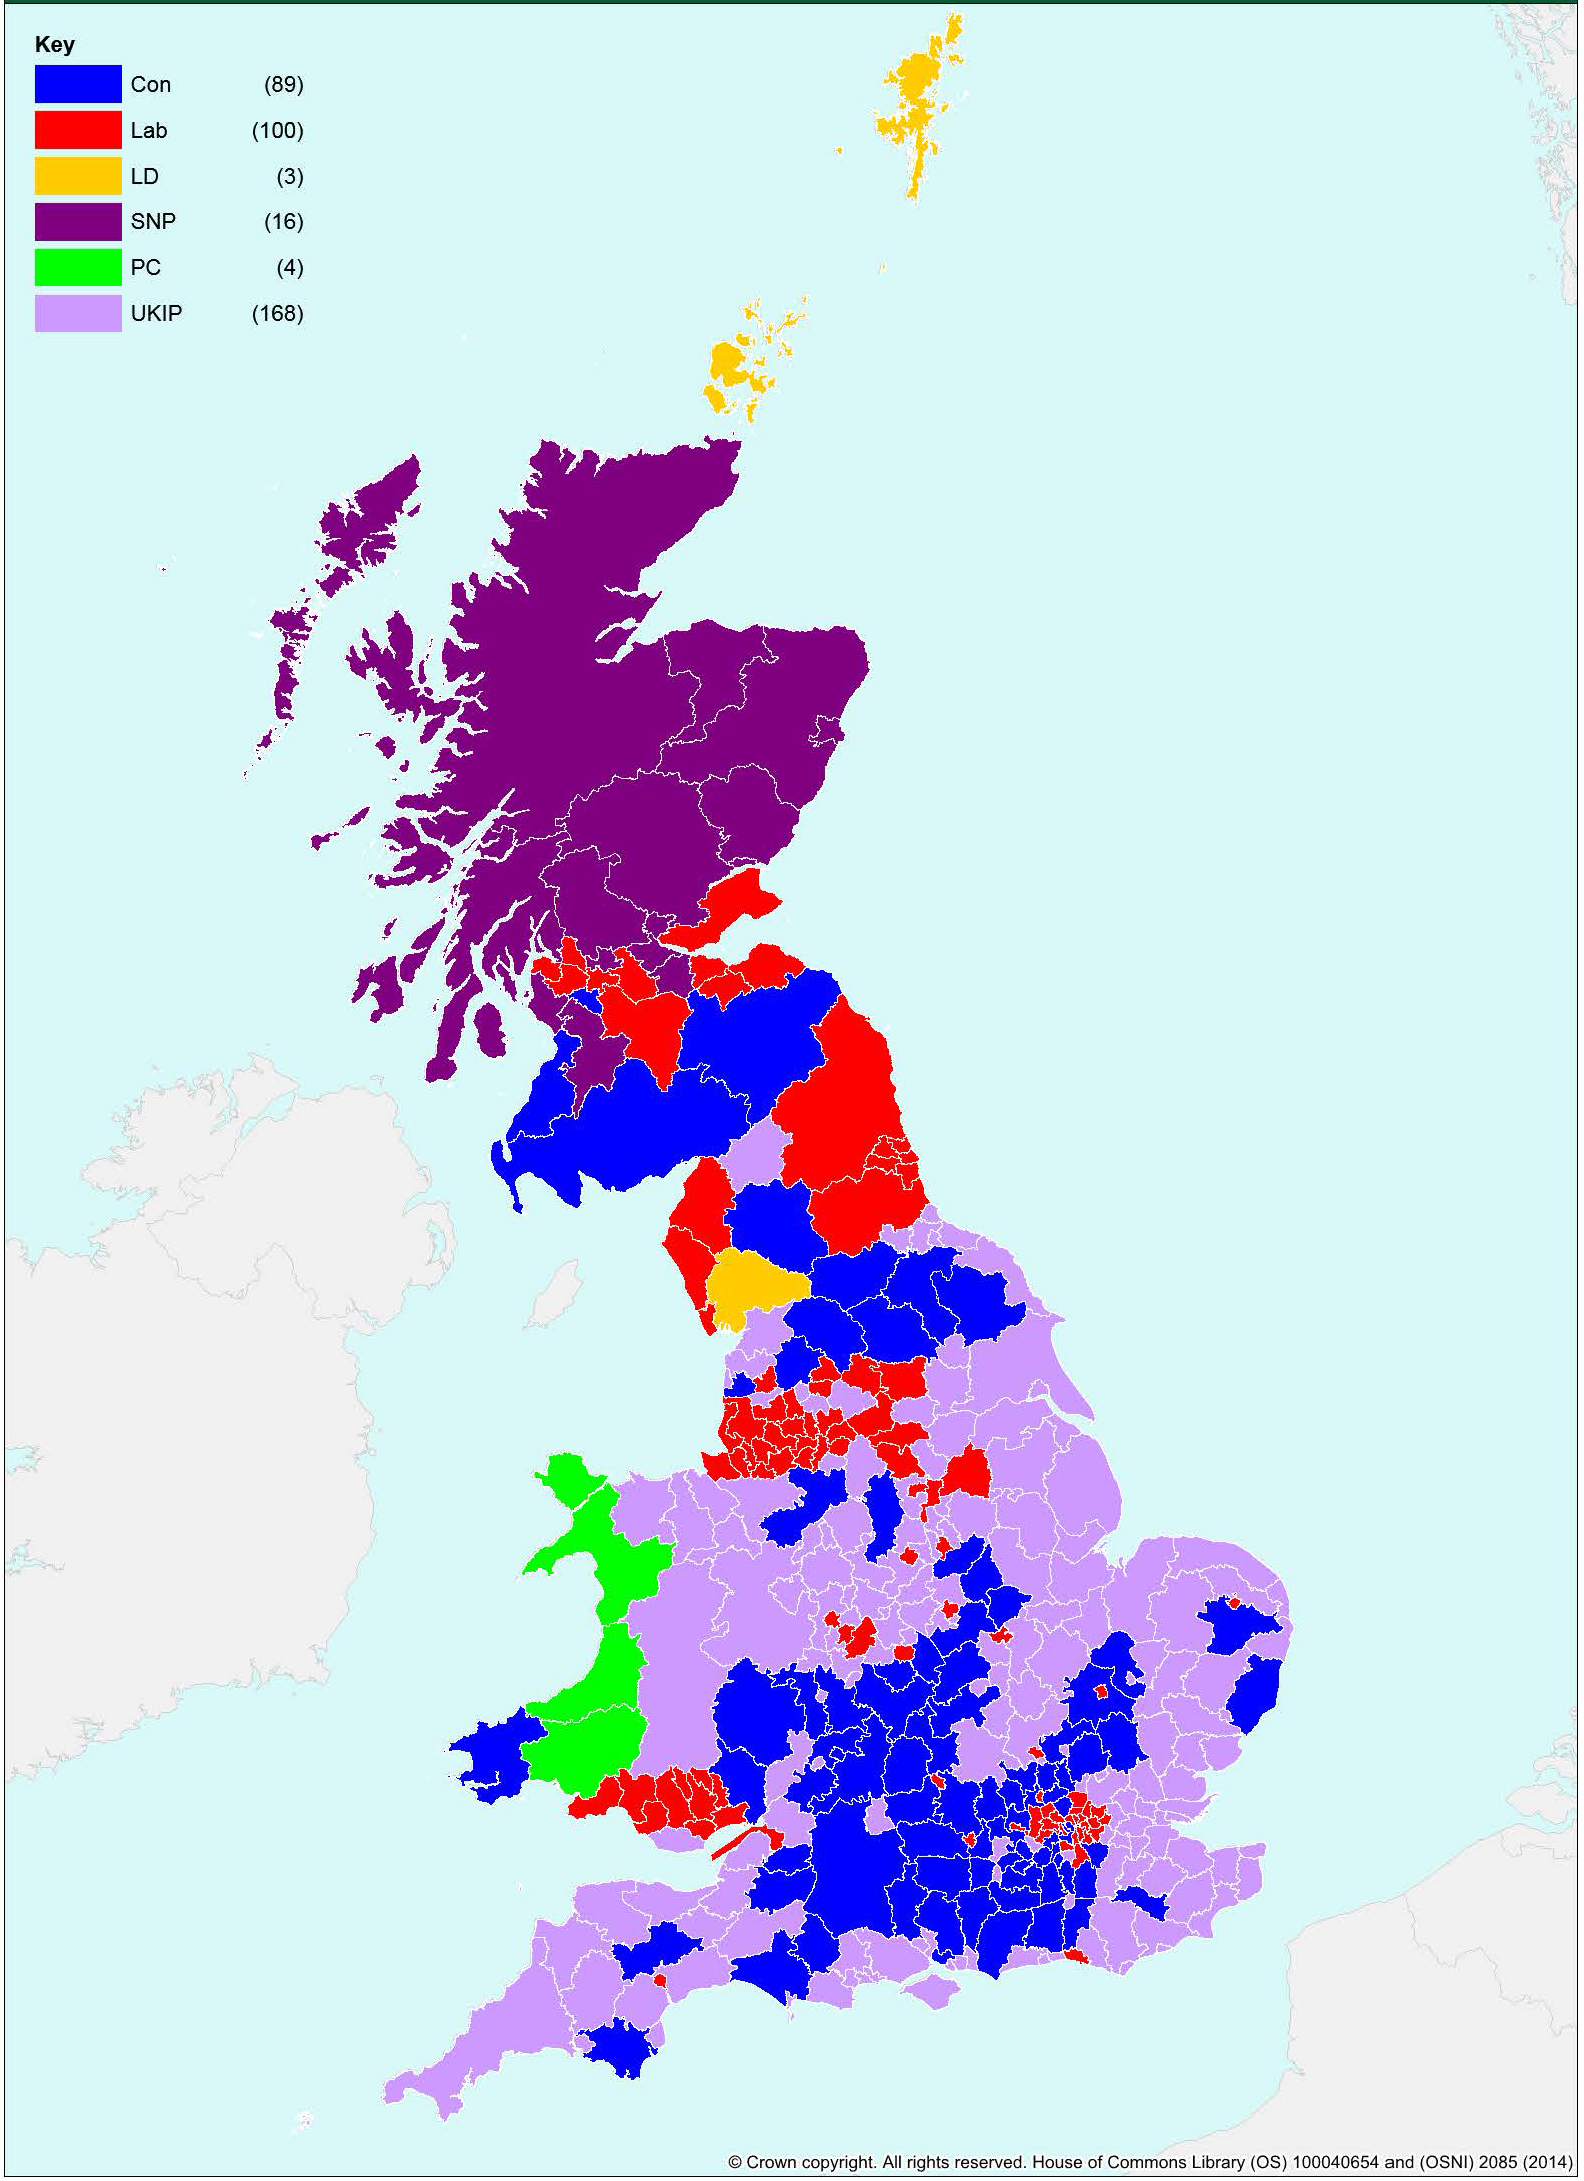
Source: Hawkins, & Miller, V, European Parliament Elections 2014, House of Commons Library Research Paper 14/32, p.32
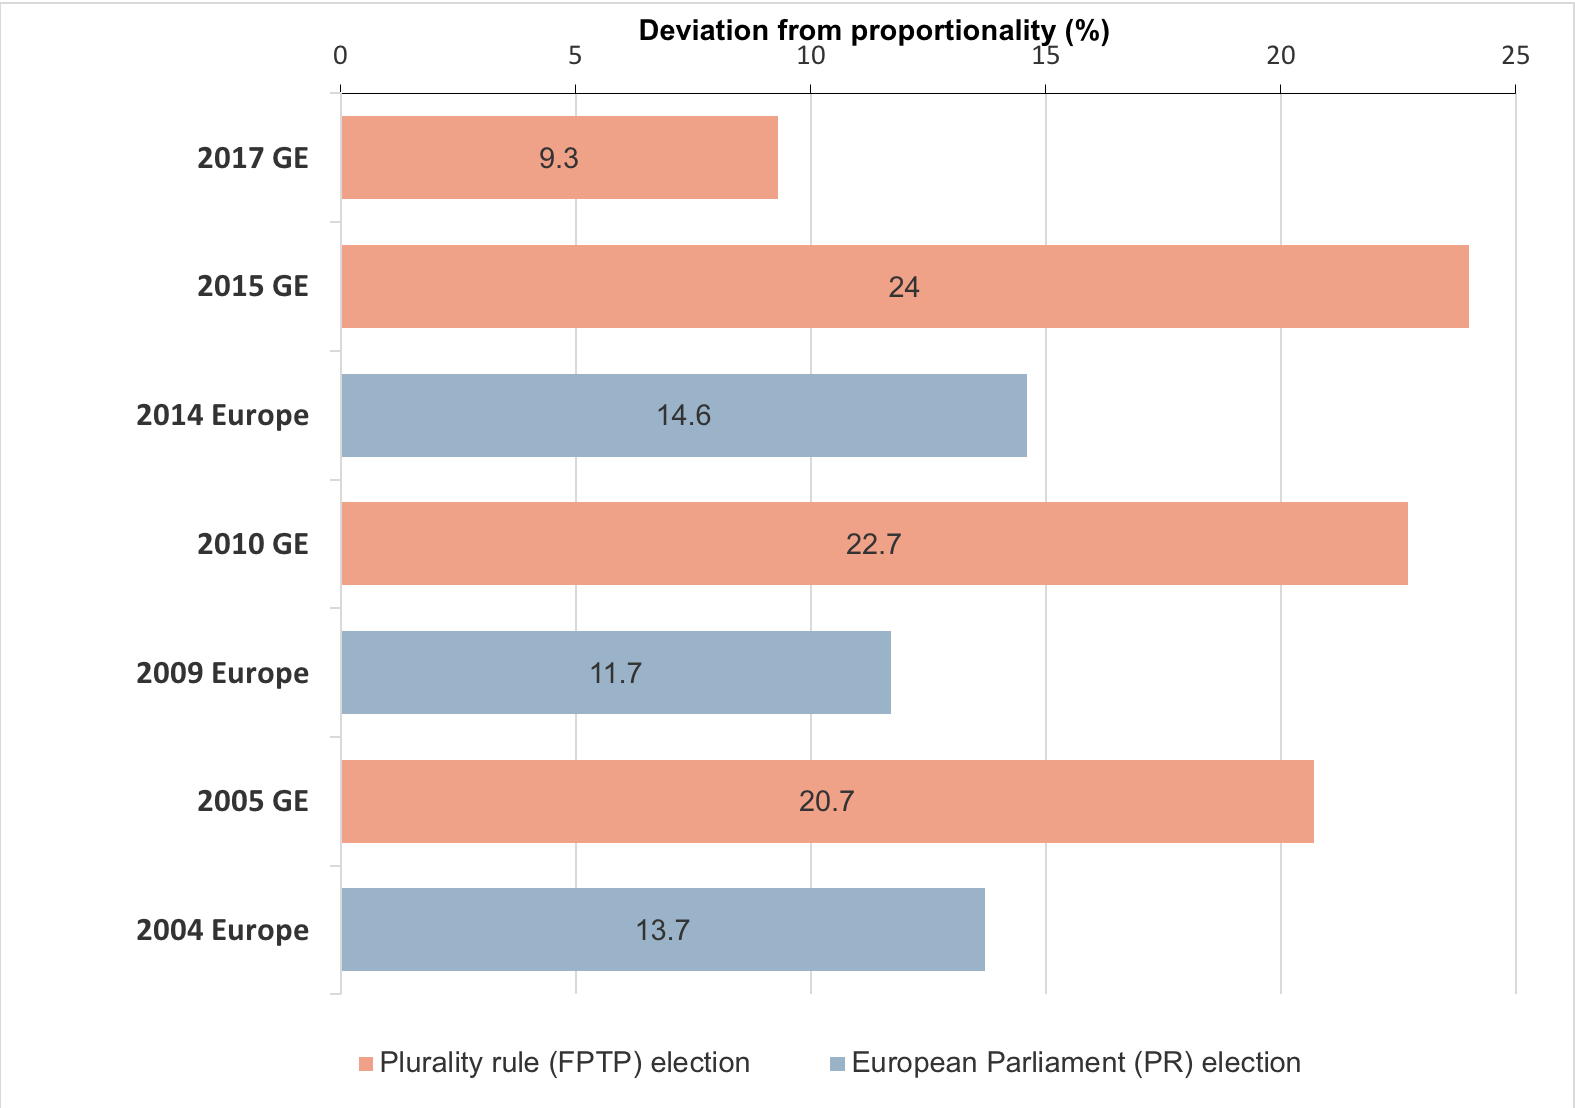
This pattern played a significant role in explaining why the Conservatives felt pushed into conceding the EU referendum in an attempt to insulate their general election vote from UKIP. UKIP, however, were considerably disadvantaged in the Westminster elections by the first-past-the-post voting system. Figure 3 shows the alternation of proportional list PR EP elections, with the historically higher disproportional FPTP general elections – until the exceptional 2017 outcome.
Figure 3: The deviation from proportionality (DV) scores (%) of European Parliament and general elections
Strengths, Weaknesses (SW) analysis
| Strengths | Weaknesses |
|---|---|
| The system was simple to use. Voters mark one X for their first-choice party. | The system was a ‘closed list’ one, where the political parties completely control the order in which candidates get elected from their list. Voters therefore cannot influence this at all. |
| The system was straightforward to count at the large regional scale and it was relatively easy for voters to understand how votes convert to seats. | Allocating seats followed the d’Hondt method, which somewhat favours the larger parties in the election over smaller ones. |
| The system was used for five elections and no major public criticisms of the system’s representativeness or useability emerged. | The UK’s number of seats in the European Parliament fell over time because of EU enlargement. The seats were removed from UK regions in a rather ad hoc manner (again by civil servants), in only rough relation to their population. |
| From 1999 to 2014 MEPs in the UK were very little known by citizens. Critics argued that the large regional constituencies used with list PR contributed to this ‘isolation’. But it seems more likely that the UK’s very inwardly focused political elites and media dynamics were chiefly to blame, since neither ever effectively engaged with the EU. The 2016 vote to leave the EU could also be interpreted as a challenge to MEPs’ legitimacy, if not necessarily the system used to elect them. | |
| With only three seats each, the two smallest regions could only give seats to the top three parties. The north-east of England could have been merged into one of its neighbouring regions, but Northern Ireland was an intractable case. | |
Minor amends were made to this article on 17 October 2018, including amending the electoral system that was used in Northern Ireland for European Parliament elections. This article is is an extract from our forthcoming book, The UK’s Changing Democracy: The 2018 Democratic Audit, published by LSE Press.
About the author
Patrick Dunleavy is Professor of Political Science and Public Policy at the LSE, co-director of Democratic Audit and Chair of the Public Policy Group.
Similar Posts
Subscribe
If you enjoyed this article, subscribe to receive more just like it.


 Democratic Audit's core funding is provided by the Joseph Rowntree Charitable Trust. Additional funding is provided by the London School of Economics.
I agree with the three preceding and veteran STV experts, Mollison, Tuffin, Sharp.
STV in the Ulster Euro-elections had the unique benefit of giving the Nationalist Catholic third of the population, one of the three seats for the EU parliament. That is because only a transferable vote can transfer votes across party divisions, to equitably elect individual candidates. The (party-proportional) open list system, proposed by Labour, for the first Euro-elections, would have split the Nationalist vote between the peace party and the war party, because, on principle, they would not share their lists.
After the Good Friday Peace agreement, SDLP supporters were more willing to transfer their later preferences to Sinn Fein candidates now at peace. You cannot do that with party list systems.
The underlying strength of STV is for a united nation and a free people, because transferable voting meets the condition of unity in liberty of choice.
John Stuart Mill: Proportional Representation is Personal Representation.
The Angels Weep: H. G. Wells on Electoral Reform.
Richard Lung:
Peace-making Power-sharing;
Scientific Method of Elections.
Science is Ethics as Electics.
FAB STV: Four Averages Binomial Single Transferable Vote.
(in French) Modele Scientifique du Proces Electoral.
The excellent post of Thomas Gray had not appeared when I posted, which is why I did not commend him with Mollison, Tuffin and Sharp!
Not just the Australian Senate but half the Australian parliaments, mainly upper chambers, use STV. More important, many non-political elections, like the professions, use STV. Party-proportional elections are a peculiarity of self-privileging politicians barbarically acting as their own referees.
Democratic Audit’s analysis of the Single Transferable Vote system of election is welcome, particularly as it highlights some of the practical experience of using the system in Scotland and Northern Ireland. However, to say that the method is ‘hard to explain to citizens’ is well wide of the mark. It rather depends on who is doing the explaining and how they do it. The mistake committed most often is to focus on the arithmetic of counting and transferring votes, or the extent to which it achieves ‘proportionality’, instead of basing the explanation on what the method is trying to do, which is to represent the wishes of all voters and reduce wasted votes. The first and best explanation I have seen was prior to the 1973 Stormont election, when the Electoral Reform Society created, at very short notice, short information films shown on Northern Ireland television.
The starting point is that single member constituencies don’t work – they can represent only one point of view and around half of those who vote end up with no representative. The only logical remedy is to have multi-member constituencies, which means that more than one candidate from a given party or point of view must be allowed to stand in each constituency. The point of STV is to allow this, whilst preventing distortion of the result by vote-splitting and ensuring that as few votes as possible are ‘wasted’, in that they elect nobody.
The three simple features that make this happen are preference voting ballot papers, election by achieving a quota of the total vote and transfer of unused votes according to the preference indicated on the ballot paper. None of these concepts is difficult to explain, although the last one needs to be demonstrated in a simple example. From experience, I can say that 16-17 year old school pupils get it immediately, after only a half-hour talk.
The last two alleged ‘weaknesses’ in the case of Scottish Local elections and Northern Ireland elections are a consequence of politicians failing to take the advice of the Electoral Reform Society. For reasons of self-interest, they imposed an artificially low limit on the maximum number of multiple members in Scottish Wards (three or four) and an artificially high minimum limit on multiple members in Northern Ireland constituencies (six). You can’t blame the system if you get the formula wrong!
As for the reason given for doing nothing (the electorate is supposed to have voted against electoral reform) the electorate did nothing of the sort. They voted against the Alternative Vote and thank goodness they did. They were never given any other reform option.
It’s useful to have this, but it does miss a few points, some of which Anthony Tuffin has already noted. Particularly important is that in STV you vote for individual candidates, so the proportionality achieved is not just party proportionality. This should be reflected in the criteria for a satisfactory electoral system: it shouldn’t translate parties’ votes into seats, it should transfer electors’ votes into seats.
As to the distant past, it misses the long history of attempts to introduce STV for Westminster elections, from the 1860s to near success during WW1. As well as translating into giving Ireland its STV system, STV was actually used for some seats in the Westminster parliament from 1918-1950 – the university seats, which elected some interesting people, including Ramsay Macdonald, John Buchan and AP Herbert.
The article is interesting and is a useful contribution to the debate about voting systems, but I hope Professor Dunleavy does not mind if I add to the debate with a few criticisms.
I’m surprised he made the mistake of including Northern Ireland in his description of the closed list system for electing MEPs. It is used only for mainland Great Britain MEPs. Northern Ireland uses STV.
He wrote, “Many voters were confused [in 2007] because the AMS elections for the Scottish Parliament and the STV elections for councils were held simultaneously”, but it is worth adding that there were more spoilt ballot papers for the AMS elections than for the allegedly complicated STV elections even though voters had voted by AMS, but not by STV, before.
In the opening section headed, “What does democracy require for an electoral system?”, the Professor says, “It should accurately translate parties’ votes into seats in the legislature”, but that seems rather one-dimensional to me. I suggest it should translate VOTERS’ votes into seats. That would include votes for parties, but it should also include votes for other reasons, such as (very topically) Remain and Brexit, on which the two major parties are divided.
The one-dimensionalism is repeated in the section headed “How proportional is the single transferable vote [STV] in UK conditions?” Although Professor Dunleavy uses the word “proportional”, the context makes it clear he means only “party proportional”. A major advantage of STV is that it can also be proportional between any other groups of importance to voters; e.g. Remain and Brexit.
In the “Conclusions” section, the Professor criticizes STV for favouring larger parties and quotes Scottish local elections as an example. This is more a criticism of the small wards adopted in Scotland for local elections than of STV per se. The problem would be much less if there were larger wards with more Councillors for each. Also, even if STV might sometimes favour larger parties, it does not disadvantage VOTERS for smaller parties, because they can still obtain representation though their later preferences.
Despite these criticisms, I agree with the conclusion, “The adoption of STV in the UK has shown that PR can work effectively under British political conditions, and that it is undoubtedly reliably [party] proportional.” I should like to add that the Ministry of Justice reported in its Review of Voting Systems on 24 January 2008 that STV was more [party] proportional than any other system used in the UK; i.e. more than AMS and closed lists.
[…] An updated, 2018 edition of this article is now available here. […]
I should like to add some perspectives to amplify Prof Dunleavy’s thorough analysis:
— his criteria are excellent but there is one that must be added: that of increasing the power and choice of the individual voter. After all, we live in DEMOcracy, not a partyocracy. People not parties come first (the ‘Jenkins’ Commission criteria of 1997/98 had an explicit criterion of increased voter choice for example).
— Prof Dunleavy is right that the Liberal Democrats advocate STV but this is not just because it is the ‘most proportional’. It is because it best combines individual voter choice with party proportionality (in fact, the latter is a happy by product of the former). Liberalism has the individual at its core and it is this which appeals strongly to Liberal Democrats.
— there was indeed voter confusion in the 2007 Scottish elections, which combined AMS parliamentary with STV local elections. Scrutiny of the voting papers revealed a far higher level of spoilt ballots in the AMS vote than in its STV counterpart however. In several anecdotal discussions with voters in Edinburgh and The Borders there was confusion expressed about the ‘double vote’ required for AMS, whereas people seemed instinctively comfortable in ranking candidates in order (1,2,3). Some of course opted to go down party lines; others spread their preferences according to their individual judgements.
Other merits of STV are largely covered by Prof Dunleavy and the comment from Mr Tuffin: it does deliver party proportionality along with greater voter choice; and it retains and enhances the local MP/constituent link which has so long been a feature of UK elections. And as Mr Tuffin rightly notes, the current dilemma over Europe, with both main parties deeply split, cannot be resolved or reflected by the FPTP system. It is this rigidity and party splits which led to the referendum in the first place; and irrespective of the result, our tradition is of representative democracy and we need badly to shore that up. The way to do it is to adopt STV as the way to make votes count equally, to increase voter choice and to bring about party proportionality.
Keith Sharp
Vice-Chair, Liberal Democrats for Electoral Reform
Council member, Electoral Reform Society
Electoral Commission observer, Scottish elections 2007