How democratic is the UK’s ‘Westminster Plurality Rule’ electoral system?
As part of the 2017 Audit of UK Democracy, Patrick Dunleavy and DA staff examine a topic of foundational importance for any liberal democracy – how well does its electoral system (in this case the Westminster Plurality Rule, aka First Past the Post) convert votes into seats?

Photo: Jessica Cross via a CC-BY 2.0 licence
This is an old version of this article. An updated, 2018 edition is available here. You can also download the full 2018 Democratic Audit from LSE Press here.
What does democracy require for an electoral system?
- It should accurately translate parties’ votes into seats in the legislature (e.g. Parliament),
- In a way that is recognised as legitimate by most citizens (ideally almost all of them).
- No substantial part of the population should regard the result as illegitimate, nor suffer a consistent bias of the system ‘working against them’.
- If possible, the system should have beneficial effects for the good governance of the country.
- If possible, the voting system should enhance the social representativeness of the legislature, and encourage high levels of voting across all types of citizens.
The plurality rule (or ‘first past the post’) voting system
Used for:
- Choosing MPs in the Westminster Parliament.
- Electing local councillors in England (see forthcoming chapter on Local Government)
How it works: The national territory is divided into constituencies, each electing one MP. Candidates stand for election from parties, and voters cast one vote for their top preference choice only. The party candidate who gets the largest pile of votes in each local area is elected. The winner doesn’t need to gain a majority (50% +1 of voters) to get elected, just more votes than anyone else.
Recent developments
The 2015 and 2017 general elections brought a host of changes, manifesting significant recent changes in the UK party system. In Scotland the Scottish National Party secured all but three of the 59 seats (95%) on the basis of 50% of the vote. In England UKIP piled up over 14% of the votes, but won only one seat (that it already held). The Liberal Democrats’ vote plunged from 23.5% to 8%, and their seats fell from 57 to just eight isolated survivors, spread across as many regions of the country. Disproportionality increased markedly in Scotland, and the south west region. Because of the collapse in the UKIP vote in 2017, the Conservatives clawed back a number of seats in Scotland but lost them elsewhere, leaving the party reliant on a confidence and supply deal with the DUP to hold on to power – despite a 45.6% vote share, almost nine percentage points higher than in 2015. A mapping of seats by party in Chart 1 below also shows what the Jenkins Commission called ‘electoral deserts’ dominated by single parties – in Scotland (now favouring the SNP); all of southern England (favouring the Conservatives); and the north-east (favouring Labour).
Chart 1: Seats won at the 2017 general election by the parties in Great Britain
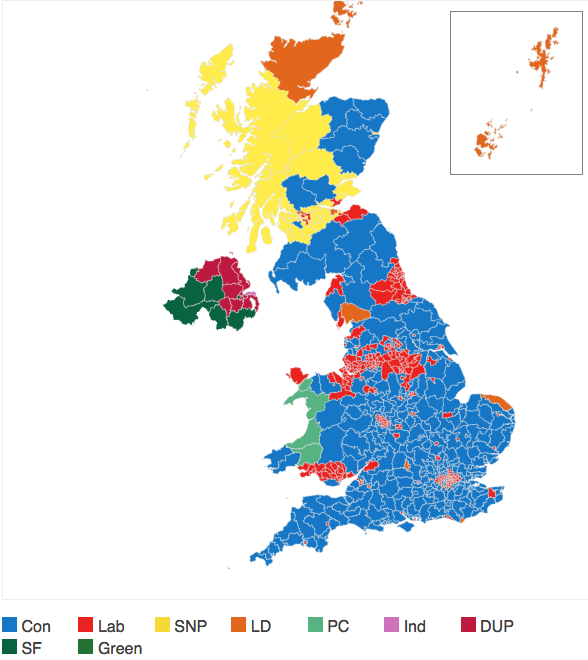
Source: BBC
Strengths, Weaknesses, Opportunities, Threats (SWOT) analysis
| Current strengths | Current weaknesses |
|---|---|
| Familiar system for British voters, dating back to medieval times. | Large minorities of voters regard the seats results as illegitimate and distorted, since they rarely match votes shares well. |
| Simple for people to vote (mark one X), easy to count, and voters can understand how the result happened. | Many voters demand an alternative system – 32% in the 2011 AV referendum, and over two-fifths consistently favour PR systems in polls. |
| 68% of voters supported the status quo in a 2011 national referendum where the reform option on offer was the ‘alternative vote’ (AV) system (used in Australia). | Plurality rule always advantages the leading parties that can pile up votes in ‘stronghold’ seats – either Conservatives or Labour (depending who’s in the lead) and now the SNP in Scotland. |
| n GB conditions, the system has tended to produce ‘artificial’ majorities for the leading party. This ‘leader’s bonus’ has allowed single party governments to be formed with ‘artificial’ House of Commons majorities. Advocates argue that this produces ‘strong’ government. Exceptions include minority or near minority governments in 1964-66, 1974, 1977-79, the Conservative-Liberal Democrat coalition 2010-15 and the DUP-supported Conservative government in 2017. | It heavily discriminates against parties with dispersed support that only run second or third in many seats – especially the Liberal Democrats and UK Independence Party, who secure millions of votes and few or no Westminster MPs. |
| Turnout levels this century range from 59 to 66%, down on earlier levels, but 30.7 million people still voted in 2015 Westminster elections, more than for any other body. | The system creates ‘electoral deserts’ for major parties – whole regions where they win millions of votes but no or few seats. So there are few Tories in northern, industrial cities; and few Labour MPs in southern England outside London. |
| The proportion of MPs in Westminster holding seats not justified by their share of the votes has been above a fifth since 1997 (see below). | |
| The proportion of MPs enjoying local majority support in their seats has fallen over the long term, despite an increase in 2015. | |
| Single party governments are based on small minorities of voters (35-42% from 2001-2017), and even smaller proportions of positively supporting citizens (22-24% from 2001-2015). | |
| Westminster has only tiny proportions of people from manual working class backgrounds, black and Asian ethnic minorities. And gender representation remains overwhelmingly male, with women MPs representing 20-29% in the last decade. In principle, parties could do better even while keeping plurality rule voting, but progress has in practice been very slow. |
| Future opportunities | Future threats |
|---|---|
| A more proportional voting system is demanded by Liberal Democrats, UKIP, Greens, the SNP and Plaid Cymru. Many people in the Labour ranks also support change, but few Conservatives. | The plurality system will probably perform more and more disproportionately and erratically, as UK voters continue to support far more than two parties. |
| Change will only come when either Labour or the Tories agree to a new system, and the party involved forms part of a coalition commanding a Commons majority, and probably a referendum majority as well. | More MPs failing to achieve majority support amongst local voters could potentially lead to a lowering of their status and legitimacy. |
| An incremental change to the Supplementary Vote system (used in London’s and other mayoral elections) could be implemented without a referendum, and might secure support from one of the top two parties. It would involve more voters in being able to choose their local MP and give each member a local majority of support. But it might well not improve proportionality. | Westminster governments may well be chosen by, and answer, to smaller and smaller proportions of the population – especially older voters in ‘safe’ seats. |
| Existing trends for younger people to vote much less and for sections of the population to reject election outcomes as unrepresentative may worsen. | |
| Westminster’s legitimacy is likely to continue to decline, compared with other UK governments and legislatures that are elected by more proportional voting systems and have stronger links to voters (as in Scotland, London, and Wales). |
How ‘unfair’ or disproportional are Westminster elections?
Political scientists have developed systematic measures of how accurately voting systems translate popular votes into seats in the legislature. The simplest and most widely used measure is the ‘deviation from proportionality’ or DV score, which shows what proportion of seats have been ‘misallocated’ to parties that do not ‘deserve’ them in terms of their overall vote shares. To calculate it, we look at the individual deviations between the vote percentage and the seats percentage for all parties, as in this small example table.
| Party | % votes | % seats | Deviation |
|---|---|---|---|
| A | 45 | 65 | +20 |
| B | 30 | 22 | -8 |
| C | 20 | 12 | -8 |
| D | 5 | 1 | -4 |
| Total | 100 | 100 |
We then add up the + and – numbers, ignoring the signs (to get a number called the ‘modulus’, which is 40 here), and then divide by two, yielding a DV score of 20 in this case. To set that in context, almost any electoral system will end up over-representing larger parties at the expense of very small ones (such as those too small to win seats even under proportional representation). So the smallest feasibly achievable DV score is actually around 5% (and not zero).
How does the UK perform on this measure? Chart 2 below shows the DV score (also called the ‘Loosemore Hanby’ measure after its inventors) for Westminster elections over time as the dark purple shaded area. Clearly the relationship between party vote shares and seats shares have become more and more disproportional over time. The 2015 general election DV score reached a new high of 24% – so that almost a quarter of MPs in the Commons are not entitled to sit there in terms of their party’s share of the national vote.
Chart 2: How the disproportionality of Westminster elections has grown over time
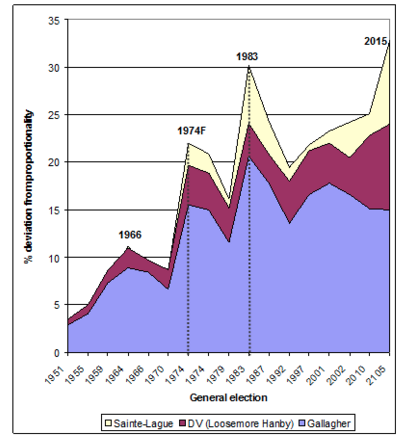
Notes: The DV line here shows the % of MPs elected to the Commons who are not entitled to be there from their party’s share of the vote – in other words how inaccurately votes are translated into seats. The practical minimum for any voting system is around 5%. For explanations of the other two lines, see the main text.
Source: Computed from data in Renwick
As with every aspect of political science measurement, there are also alternatives to the DV score. Chart 2 shows two main contenders, explained in more detail by Alan Renwick. Suffice to say here that the ‘Gallagher’ measure (shown light blue) is the most conservative index and arguably understates disproportionality by focusing only on the largest deviation. In 2015 this did not increase in 2015 because the Liberal Democrat vote collapsed and UKIP (although almost unrepresented in MPs) had a smaller 14% vote share. The third measure, the ‘Sainte Lague’ (shown pale yellow) is more orientated to the under-representation of smaller parties. It has been consistently above the DV score since 1974, and also shows the 2015 election as a post-war peak of disproportionality.
So far we have looked at national DV only, but in democratic terms what matters a lot also is how fairly elections seem to operate to citizens on the ground, in their own local area. When people support a particular party, what happens to that kind of vote in their surrounding area? We cannot compute DV for a single seat, of course, but we can look at the twenty seats nearest to every constituency across Great Britain and calculate the level of local DV that voters will experience in the area around them. Chart 3 shows the levels of deviation from proportionality that people experienced, with low scores shown purple and high scores yellow. They ranged very high in both 2010 and 2015, with some local DV scores at or above 40% DV scores in the worst cases, far higher than the national DV numbers (23% and 24%).
Chart 3: How much deviation from proportionality do voters experience in the local area ‘around them’?
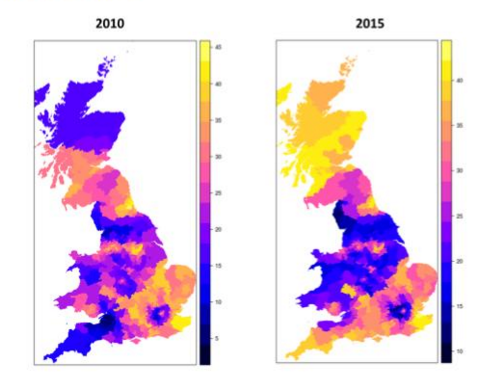
Note: The scale here shows the percent DV score in the 20 seats closest to each constituency in the country
Sources: Chris Hanretty
The side by side comparison in Chart 3 also shows how erratically plurality rule elections can operate from one year to the next. In 2010 with the Liberal Democrats riding high, south west England was one of the most proportional regions (purple). But by 2015, with Liberal Democrat support plunging, it was one of the most disproportionate regions (yellow). And in Scotland, the 2010 outcomes were disproportionate in the central lowlands with Labour as the key beneficiary, but more so by 2015 when the SNP was the sole beneficiary. However, there was consistently bad performance in Tory seats across southern and eastern England for decades, and also in Labour’s north east stronghold. But local DV eased off a bit in 2015 in areas around some northern Labour cities and former industrial regions.
A third aspect of disproportionality involves recognizing that nations differ a great deal in how their political parties and party system operate, with big implications for DV scores. So perhaps one of the best indicators to look at is how Westminster elections compare with other elections held under British political conditions, but using different electoral systems (discussed in detail in forthcoming sections). Chart 4 below shows that Westminster elections have been far more disproportional than all the other major electoral systems now used in the UK. For decades now over a fifth of the House of Commons have been MPs for parties over-represented at other parties’ expense. By contrast, the Scottish Parliament, using a form of proportional representation has consistently been around 11%, half the Westminster rate. And the Greater London Assembly is not much higher than this, despite having only 25 elected members. In Wales the electoral system has too few ‘top up’ seats to give fully proportional outcomes, so the results there shows higher DV scores, over 14%. The elections for the European Parliament are held in the UK using a regional proportional representation system. Its accuracy is restricted by the small number of seats per region, so again this delivers only 14% DV scores – but this is still two-thirds of Westminster levels.
Chart 3: How disproportional have Westminster elections been over the last two decades, compared with other British elections?
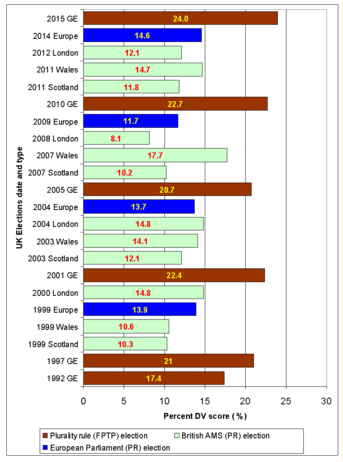
Note: The chart shows the % of MPs or representatives elected who are not entitled to their seats from their party’s overall share of the vote – in other words how inaccurately votes are translated into seats. The practical minimum for any voting system is around 5%.
Source: Patrick Dunleavy, GV311 lecture, LSE 1 December 2015.
Overall then, it can be seen first that 2015 represents a new post-war high in the UK electoral system’s disproportionality. Second, the levels of ‘unfairness’ experienced by voters at the local and regional level are much higher than the overall national figure suggests. For instance, Scotland in 2015 very nearly saw the SNP winning every single seat for which the party stood, despite only winning 50% of the vote. Third, Westminster elections are far more disproportional than other kinds of British elections held using different voting systems.
Finally, in comparative terms, the UK’s Westminster elections are now almost five times more disproportional than the practicable minimum achievable in a modern electoral system. They consistently perform among the worst of any liberal democracies worldwide. For example, the USA uses plurality rule elections, but DV levels there can be as low as 7-8% – because the Democrat and Republican parties still dominate all politics there, and a plurality rule voting system can work quite fairly with just two national parties in the race. As the UK continues its transition to a fully multi-party democracy on the normal European pattern, so the future of Westminster elections will certainly continue to be marked by high levels of mismatch between the parties that citizens support and those who win seats in Parliament – unless and until reform to a more modern and accurate voting system takes place.
This post does not represent the views of the London School of Economics or the LSE Public Policy Group.
Patrick Dunleavy is Professor of Political Science and Public Policy at the LSE, co-director of Democratic Audit and Chair of the Public Policy Group.
![]()
Similar Posts
Subscribe
If you enjoyed this article, subscribe to receive more just like it.


 Democratic Audit's core funding is provided by the Joseph Rowntree Charitable Trust. Additional funding is provided by the London School of Economics.
[…] the 1, 2, 3 voting used for STV, at the same time as voting for the Edinburgh Parliament using first past the post, proved a disaster. None the less the results were fairly stunning, with more SNP councillors being […]
[…] Westminster electoral system’s deviation from proportionality, which is 22.5 per cent (see our Audit on FPTP). Table 1 below shows that the Scottish AMS system has performed twice as well in terms of matching […]
How democratic is the UK’s ‘Westminster Plurality Rule’ electoral system? Not very. https://t.co/ovLyJiY6OG
A look at the electoral system in the #UK and “how well does it convert votes into seats >https://t.co/qg7EVw1Kzj Our #ff @democraticaudit
1st post in 2016 Audit of UK democracy: How democratic is the ‘Westminster Plurality Rule’ electoral system? https://t.co/TBDtdPJMYt #FPTP
How democratic is the UK’s ‘Westminster Plurality Rule’ electoral system? https://t.co/yKXKtWbBNz
How democratic is the Westminster electoral system? The first instalment of the 2016 Audit of Democracy https://t.co/rpGaKRIGHG
How democratic is the UK’s ‘Westminster Plurality Rule’ electoral system? https://t.co/MWOQruiARm
How democratic is the UK’s ‘Westminster Plurality Rule’ electoral system? https://t.co/PATzmiHK4T
How democratic is the UK’s ‘Westminster plurality rule’ electoral system? https://t.co/rpGaKRIGHG
How democratic is the UK’s ‘Westminster Plurality Rule’ electoral system? https://t.co/OW7HPvE7R3 https://t.co/PgMv2xkIrq