How democratic are the reformed electoral systems used in mayoral and devolved elections?
As part of the 2017 Audit of UK Democracy, Patrick Dunleavy and DA staff examine how democratic the two big reformed electoral systems used in the UK – the ‘Additional Members System (AMS)’ and the ‘Supplementary Vote (SV)’ are, and how successful they have been in showing the way for more modern electoral systems under British political conditions.

The Mayor of London Sadiq Khan in October 2016. Photo: Lee via a CC-BY-NC-SA 2.0 licence
This is an old version of this article. An updated, 2018 edition is available here. You can also download the full 2018 Democratic Audit from LSE Press here.
What does democracy require for an electoral system?
- It should accurately translate parties’ votes into seats in the legislature (e.g. Parliament)
- In a way that is recognised as legitimate by most citizen (ideally almost all of them).
- No substantial part of the population should regard the result as illegitimate, nor suffer a consistent bias of the system ‘working against them’.
- If possible, the system should have beneficial effects for the good governance of the country.
- If possible, the voting system should enhance the social representativeness of the legislature, and encourage high levels of voting across all types of citizens.
Since 1999 voting systems in the UK have diversified. The first Blair government, with Liberal Democrat co-operation, created proportional Additional Member Systems (AMS) between 1998-2000 for new devolved bodies in Scotland, Wales and London. These will have their fifth round of elections in May 2016. Labour also set up the successful London Mayor system, and since 2010 Conservative ministers have encouraged ‘strong mayor’ elections elsewhere, further expanding the use of a second ‘Supplementary Vote’ (SV) system.
‘Additional Member’ Systems in Scotland, Wales and London
Used for: choosing MSPs in the Scottish Parliament, AMs in the Welsh National Assembly and members of the Greater London Assembly (GLA).
How it works: In ‘classic’ versions of AMS (used in Germany and New Zealand) half of the members of these bodies are locally elected in constituencies using first-past-the-post’, FPTP voting. The remaining half (the ‘additional’ or ‘top up’ members) are elected in larger regional areas, where a whole set of seats are allocated using a proportional representation system – so as to make parties’ seat shares match their vote shares as accurately as possible. Voters cast two ballots: one for their constituency representative, and one for their top-up region representative.
In ‘British AMS’, because constituency representation was seen as historically and culturally important in the UK, there are more local constituency seats than top-up seats. In Wales though, the proportion of top-up seats (at 1/3) is sometimes too small to ensure proportional outcomes, if one party is heavily over-represented in the constituency seats. In Scotland and Wales the top-up areas are sub-regions. For the Greater London Assembly the top-up area is the whole of London.
| Body | Local seats | Top-up seats | Total |
|---|---|---|---|
| Scottish Parliament | 73 (57%) | 56 (43%) | 129 |
| Welsh Assembly | 40 (67%) | 20 (33%) | 60 |
| Greater London Assembly | 14 (56%) | 11 (44%) | 25 |
Voters get two ballot papers, one for their local constituency and one for the wider regional contest, and they mark one X vote on each paper. The local constituencies use FPTP, so whoever gets the largest vote in each local area is the winner.
In AMS voters also have a second vote for their regional top-up members. To decide who gets top up seats, each party puts forward a slate of candidates (their ‘list), and voters choose one party to support. We look at how many local seats a party already has within region A from the local contests, and what share of the list votes it has in the A region. If a party already has its full share of seats, it gets none of the top-up members. But if the party does not have enough seats already it is assigned additional members, taken from its list of candidates, so as to bring each party as closely as possible to having equal percentages of seats and votes (for the top-up area stage).
There’s a formula for doing this that works near perfectly given large top-up areas. However, it may over-represent larger parties if a lot of the list vote is split across multiple smaller parties, which tends to happen quite a lot in British AMS elections.
Recent developments
A key rationale for the three AMS systems is to offer proportional representation for each of the bodies involved. In evaluating this claim it is worth bearing in mind as a benchmark the Westminster electoral system’s deviation from proportionality, which is 22.5% (see our Audit on FPTP). Table 1 below shows that the Scottish AMS system has performed twice as well in terms of matching party seats shares with their vote shares, and the London system has fared almost as well. In Wales DV scores are higher, because there have been too few top-up seats, especially in 2007. But still, on average, DV scores are routinely two thirds of UK general election scores.
Table 1: The deviation from proportionality (DV score) of British AMS elections
| Scotland | Wales | London | ||
|---|---|---|---|---|
| 2011 | 11.8 | 14.7 | 12.1 | 2012 |
| 2007 | 10.2 | 17.7 | 8.1 | 2008 |
| 2003 | 12.1 | 14.1 | 14.8 | 2004 |
| 1999 | 10.3 | 10.6 | 14.8 | 2000 |
| Average | 11.1 | 14.3 | 12.5 | Average |
Note: The DV score shows the percent of representatives not entitled to their seats in terms of their party’s share of the overall vote. Its practical minimum level is c.5%.
Proportional voting systems tend to produce coalition or minority governments, unless some party can command a clear majority of votes on its own. Table 2 shows that the AMS systems have only delivered two single-party government outcomes: in London in 2016, and when the SNP won an outright majority in Edinburgh in 2011, following a period when they ran a minority government (2007-11). In Wales Labour has been continuously in government, but has never had an outright majority. The arrangements for forming governments have generally fared well in all three bodies, without prolonged uncertainty and with party divisions generally not being rancorous.
Table 2: Governing outcomes of the Additional Member System elections
| Scottish Parliament (129 MSPs) | Welsh Assembly (60 AMs) | Greater London Assembly (25 members) | ||
|---|---|---|---|---|
| 2016- | SNP (63 seats) minority government | Labour (29 seats) minority government | Labour mayor. Labour (12 seats) largest party | 2016- |
| 2011-16 | SNP (69 seats) majority government | Labour (30 seats) minority government | Divided government, Conservative mayor. Labour (12 seats) largest party | 2012-16 |
| 2007-11 | SNP (47 seats) minority government | Labour (26 seats) coalition government with Plaid Cymru (15 seats) | Divided government, Conservative mayor. Conservatives (11 seats) largest party | 2008-12 |
| 2003-07 | Labour (50 seats) coalition with Lib Dems (17 seats) | Labour (30 seats) government (with effective majority of 1) | Divided government, Labour mayor. Conservatives (9 seats) largest party | 2004-12 |
| 1999-2003 | Labour (56 seats) coalition with Lib Dems (17 seats) | 1999-2000: Labour (28 seats) minority government. From 2000: Labour (28 seats) coalition with Lib Dems (6 seats) | Divided government, independent (previously Labour) mayor. Labour and Conservatives both 9 seats | 2000-04 |
Strengths, Weaknesses, Opportunities, Threats (SWOT) analysis
| Current strengths | Current weaknesses |
|---|---|
| The AMS systems were purpose-designed for all three bodies. The Edinburgh system was defined by a constitutional convention, and the GLA system by political scientist consultants. The Cardiff arrangements, however, were a political ‘fix’ decided by the Welsh Labour party. | We noted above the shortage of top-up seats in Wales, which explains higher DV scores here, especially in strong Labour years. |
| It is simple for citizens to vote for a local representative. Some critics predicted that citizens would see constituency voting under AMS as more important than top-up votes; and in the 2000 London elections one in six voters did not use their List vote. However, by 2008, 2012 and 2016 more people voted in the top-up election than in the constituency stage. | In London the Assembly has only 25 members, so every seat-switch between parties reallocates 4% of the total. So this is not a ‘fine-grain’ measure of party support. |
| AMS is easy to count, and it is straightforward for voters to understand how the overall result happened. All outcomes have had high levels of public acceptance and legitimacy. | London’s DV score is also a bit higher because by law no party can win a top-up seat unless they get 5% of the London-wide (list) vote. |
| AMS is easy to count, and it is straightforward for voters to understand how the overall result happened. All outcomes have had high levels of public acceptance and legitimacy. | The detailed counting rule used to allocate top-up seats (called the d’Hondt rule) somewhat favours the one or two largest parties in all three cases. As in any electoral system, votes going to very small parties (below say 3% of the total) are unlikely to secure any representation – and in London cannot do so. |
| Election results for all three bodies have been more proportional than for Westminster elections (see above). | Outside London, the systems do not seem to have improved the representation of ethnic minorities or of people from manual backgrounds. |
| Turnout levels have been highest in Scotland at 49 to 59%. Wales has averaged 43%. London turnout grew from 33% in 2000 to 45% in 2008 and 46% in 2016. | |
| Under AMS, parties have incentives to put equal numbers of men and women on their top-up lists. Somewhat more representatives are women than in the Commons, with 35% of the Scottish Parliament, 36% of the London Assembly and 40% of Welsh National Assembly female members. |
| Future opportunities | Future threats |
|---|---|
| There are some reform demands to create more top-up members in the Welsh National Assembly, which is like to make results more proportional. | Both Scotland and Wales are unicameral legislatures, so there is no upper house to constrain the behaviour of a party that becomes dominant there. |
| Over the 18 years it has been operating, the Scottish Parliament has gained far greater autonomy over more public spending and attracted high levels of public trust. Wales and Greater London are also pressing Whitehall for their powers to increase, and they have broad public support for such a change on their areas. | The SNP has emerged as a ‘dominant party’ in Scotland, especially since the 2014 referendum. There have been complaints of overly strong/unchecked executive rule by the party. However, 2016 saw a revival in the Conservative vote, and there are no regional ‘electoral deserts’ in Scotland without multi-party representation. And no electoral system can ensure more diversity of parties than citizens have voted for. |
| As these bodies become more significant and permanent in the eyes of citizens, voters’ interest, turnout levels and media coverage may all increase, especially in Scotland. |
The Supplementary Vote for electing executive Mayors and Police Commissioners
Used for: choosing the Mayor of London; executive mayors in 16 English local authorities, mainly large cities; and choosing all Police Commissioners in England and Wales. From 2017 onwards SV will also be used to elect ‘regional’ executive mayors in six major areas outside London.
How it works: No election for a powerful executive position (such as a mayor or president) can operate in a proportional way, because the single office cannot be divided between parties. Instead the Supplementary Vote system tries to involve as many voters as possible in deciding on the winner.
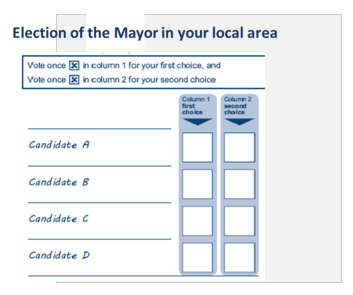
Voters have a ballot paper with two columns on it, one for their first choice and one for their second choice. They put an X vote against their chosen candidate in the first preference column, and then (if they wish) an X also in the second preference column.
The key difference between the SV and FPTP sytems is what candidates must do to get elected, as the system is designed to make leading candidates ‘reach out’ to voters outside their own party’s ranks.. At the start first preference votes only are counted. If anyone has more than 50% at this stage then they are elected straightaway, and counting ends.
However, if no one has overall majority support, then the top two candidates go into a runoff stage on their own, where the second preference ballot papers of eliminated candidates are checked. Second choice votes for one of the two candidates still in the race are added to their piles. Once all relevant second votes are added in, whoever of the two top candidates has the most votes overall is the winner.
This process of knocking out all the low-ranked candidates at once, and redistributing their voters’ second choices, ensures that the largest feasible number of votes count in deciding who is elected. The person elected can only be one of the initial top two runners (unlike the Alternative Vote, rejected at the 2011 referendum). And yet in practical terms they always have a majority of eligible votes cast. In repeated London elections, there has been nearly three fifths support for the winner.
Recent developments
The supplementary vote was first approved has been used five times to elect the London mayor, in numerous contests for other mayors, and in the 2012 and 2016 elections of Police and Crime Commissioners. Table 1 shows that in London over four fifths of voters take the opportunity to give both a first and a second preference vote. Turnout levels in London also rose from just over a third in 2000 to over 45% in 2016.
Table 1: Major elections held under the Supplementary Vote from 2000
| 1st preference votes (m) | 2nd preference votes (m) | 2nd as % of 1st | Turnout % | |
|---|---|---|---|---|
| Police and crime commissioners (England & Wales) 2016 | 8.88 | 1.25 | 14.2 | 26.6 |
| Police and crime commissioners (E&W) 2012 | 5.36 | 3.41 | 63.7 | 15 |
| London mayor 2016 | 2.57 | 2.30 | 89.6 | 45.3 |
| London mayor 2012 | 2.21 | 1.76 | 79.8 | 38.1 |
| London mayor 2008 | 2.42 | 2.00 | 82.9 | 45.3 |
| London mayor 2004 | 1.86 | 1.59 | 85.4 | 37 |
| London mayor 2000 | 1.71 | 1.42 | 82.9 | 34.4 |
By contrast, the first Police Commissioner elections in 2012 were poorly run. They were held in November, at a cold time of year, with little advertising and separate from normal local elections– resulting in a 15% turnout. There was little publicity about the new positions or the candidates, and large numbers of voters were using SV for the first time. Yet, even so, just under two thirds of voters cast a second preference, and the results were accepted as a sound reflection of the views of those voting. Turnout improved significantly in 2016 but the number of second preference votes dropped sharply.
A possible key problem of the Supplementary Vote concerns whether voters can accurately identify who the top two candidates are in advance, so as to use their second preference vote effectively. If a voter does not use either of their preferences for one of the top two candidates then their input does not determine who wins. The London Mayor election has always been well forecast and Table 2 shows that even in the first 2000 election the proportion of effective votes was over three quarters. As voters learnt more about how the system worked that proportion has increased, falling back only slightly in 2016. Thus SV in London has indeed maximised the number of votes that count.
Table 2: How voters in the London mayoral election became more ‘effective’ in choosing candidates to support (millions of votes)
| Winner | Runner-up | Effective votes | All votes | % of votes effective | |
|---|---|---|---|---|---|
| 2016 | 1.31 | 0.99 | 2.30 | 2.60 | 88.5 |
| 2012 | 1.05 | 0.99 | 2.05 | 2.21 | 92.7 |
| 2008 | 1.17 | 1.03 | 2.20 | 2.46 | 89.4 |
| 2004 | 0.83 | 0.67 | 1.50 | 1.92 | 77.9 |
| 2000 | 0.78 | 0.56 | 1.34 | 1.75 | 76.5 |
Outside London there has been a limited trend for major cities to adopt the executive major system (like Watford, Bristol, Liverpool and Leicester), and elections there generally operate similarly to London, with Labour versus Conservative run-off contests. However, the Labour candidate in Liverpool in 2014 won outright with 55% of the first-preference votes.
Following devolution deals negotiated between council leaders in six areas and Conservative ministers, new ‘regional mayor’ elections are expected to be set up and begin operating in 2017 in Greater Manchester (where the mayor will control health service and infrastructure spending), the Liverpool City Region, the North East, the Sheffield City Region, Tees Valley and the West Midlands.
Strengths, Weaknesses, Opportunities, Threats (SWOT) analysis
| Current strengths | Current weaknesses |
|---|---|
| A brand new system introduced first in London in 2000, and designed by political scientist consultants. The system is popular with voters. | Some critics have argued that the person chosen may not quite have a majority of all the votes cast. This is because some people may give both their first and second choice votes to smaller party candidates, who stand no chance of being in the final top two run-off. But then no other voting system can achieve this in practice either. |
| The SV system is simple for voters to use and supporters of small parties can express their real feelings with their first vote, but still use their second vote to choose which of the top two candidates they prefer to win. | SV is like an ‘instant run-off’ version of double-ballot elections (used e.g. in France, where if no one gets a majority on the first ballot, voters must come back a week later and vote again). Some critics argue that it is hard for voters to know in advance who the top two candidates are likely to be. But in London and most local areas this should be reasonably clear. |
| SV is straightforward to count, even at large scale - around 2 million votes are counted overnight in the London-wide Mayoral contest, using electronic counting. Voters can easily understand how the count operated and the result happened. | English local authorities have had the chance to introduce executive mayors since 2000, and 16 now use this system. In three areas mayoral systems were used for a time but then abandoned following local referenda. In 2011 voters in nine areas turned down executive mayors in referenda imposed on local voters. |
| Election results for London Mayor have shown winners getting nearly 60% of all eligible and counted votes. The four results so far have all been accepted as accurate, giving incumbents of the office very high levels of public acceptance and legitimacy. | One or two early mayoral elections saw victories for unlikely or allegedly ‘joke’ candidates with high name recognition. This has not persisted. |
| No major public criticisms of the system have emerged. | |
| Recent turnout levels in London at 40-45% are high for local elections. |
| Future opportunities | Future threats |
|---|---|
| The creation of new executive Mayors for Manchester, Yorkshire and other northern English city-regions (e.g. with powers over health spending) could improve public knowledge of the SV system. | Some local authorities with an executive mayor may still revert back to a council system after a local referendum. But again this is for wider reasons, not dissatisfaction with SV. |
| Some local authorities without elected mayors may also adopt them in future. | |
| Turnout for Police Commissioner elections improved significantly in 2016, when they were run alongside local elections. This again may boost public awareness of SV. |
Conclusion
All three Additional Member Systems have operated effectively and the electoral legitimacy of governments in Scotland and Wales has been high. Furthermore, the representativeness of the Scottish Parliament and Welsh National Assembly has not been questioned by the public or the media. In London the GLA elections have been seen as fair, and its scrutiny role has secured some public profile in holding to account the executive Mayor.
The Supplementary Vote system has also proved very successful, working very effectively in London in elections so far, and because of that also spreading out to shape the choice of more and more directly elected public officials in England, with a high degree of non-partisan support. This is a rare case of a reformed electoral system spreading incrementally to new bodies and policy areas.
—
This post does not represent the views of the London School of Economics or the LSE Public Policy Group.
Patrick Dunleavy is Professor of Political Science and Public Policy at the LSE, co-director of Democratic Audit and Chair of the Public Policy Group.
![]()
Similar Posts
Subscribe
If you enjoyed this article, subscribe to receive more just like it.


 Democratic Audit's core funding is provided by the Joseph Rowntree Charitable Trust. Additional funding is provided by the London School of Economics.
How democratic are the reformed electoral systems used in mayoral and devolved elections? https://t.co/yvxqUVIhUb
How democratic are the reformed electoral systems used in mayoral and devolved elections? https://t.co/Y6xXoshaNY
Which reformed electoral system has spread far & wide in England? The Supplementary Vote used in mayoral elections. https://t.co/mYeuCUpzIh
How democratic are the reformed electoral systems used in mayoral and devolved elections? https://t.co/4WEH7BrdCQ
I don’t know but I love those knitted dolls
What does democracy require for an electoral system?
It requires:
one that disempowers parties and empowers voters by allowing voters to vote for specific individuals rather than “the party’s nominee”
one that encourages the diversity of opinion in the country to be represented in a truly representative parliament or assembly.
AMS fails these tests.
[…] How democratic are the reformed electoral systems used in mayoral and devolved elections? Democratic Audit UK, 18 January 2016 […]
How democratic are the reformed electoral systems used in mayoral and devolved elections? https://t.co/LVkcGAjAYc
P Dunleavy examines how democratic are the reformed electoral systems used in mayoral and devolved elections: https://t.co/yQzhNG9tSk
How democratic are the reformed electoral systems used in mayoral and devolved elections? https://t.co/mYeuCUpzIh
How successful are the AVS and SV in showing the way for reformed #ElectoralSystems in #GB?Good overview:https://t.co/EcBmIFL6hB @PJDunleavy
How democratic are the reformed electoral systems used in mayoral and devolved elections? https://t.co/ZJDfj4wMPl https://t.co/AZO2gY2aC2