How democratic are the UK’s two proportional electoral systems?
As part of the 2017 Audit of UK Democracy, Patrick Dunleavy and DA staff examine the two proportional (PR) electoral systems now used in the UK, albeit for smaller elections – Scottish and Northern Irish local government, and choosing Members of the European Parliament (although the latter will come to an end when Britain leaves the EU). How have they fared in converting votes into seats and fostering political legitimacy? Do they show that PR can work well under British political conditions?
Credit: Jasn via a CC BY-NC 2.0 licence
This is an old version of this article. An updated, 2018 edition is available here. You can also download the full 2018 Democratic Audit from LSE Press here.
What does democracy require for an electoral system?
- It should accurately translate parties’ votes into seats in the legislature (e.g. Parliament)
- In a way that is recognised as legitimate by most citizens (ideally almost all of them).
- No substantial part of the population should regard the result as illegitimate, nor suffer a consistent bias of the system ‘working against them’.
- If possible, the system should have beneficial effects for the good governance of the country.
- If possible, the voting system should enhance the social representativeness of the legislature, and encourage high levels of voting across all types of citizens.
The Single Transferable Vote (STV) System in Scottish local government and Northern Ireland
Used for: electing local councillors across Scotland and Northern Ireland; and for choosing members of the Northern Ireland Assembly.Elsewhere in the world STV is only used to elect parliaments in Ireland and Malta.
How it works: All representatives are elected in larger local constituencies that have multiple seats (usually between three and five). The Single Transferable Vote (STV) seeks to allocate seats to different parties in direct relation to their votes, so as to end up with minimum differences between seat shares and vote shares. Within each multi-seat constituency, parties put up candidates in a list. Voters mark their preferences across parties, and within parties across candidates, using numbers. Voters therefore have the option to support candidates from across different parties, so as to exactly match their personal preferences. A complex counting process then operates that allocates seats in an order to the candidates that have most votes, so as to get the best fit possible between party vote shares and their number of local MPs.
The total number of votes cast is divided by the number of seats being contested plus one. This gives a ‘quota’, or a vote share that guarantees a party one seat. (eg if 100,000 people have voted, and we have 4 seats to elect in a constituency, then the quota would be 100,000 divided by (4+1) = 20,000 votes). Any candidate with more than a quota gets a seat straightaway. Every time a seat is allocated, we deduct one quota share of votes from the total and any surplus votes are redistributed.
Once this has been done, a different method is used to knock out candidates from the bottom. The least popular candidate is eliminated from the race, and their voters’ second preferences are redistributed across the candidates still in the race. This is repeated until one of the parties still in the race has enough votes for a quota and so wins the next seat. We then deduct this quota from the total votes (as above) and carry on with the ‘knocking out the bottom candidate’ process until all the seats are allocated.
Recent developments
The single transferable vote was introduced into the UK because of sectarian conflicts between the Protestant and Catholic communities in Northern Ireland during the period from 1968-2008. The system was viewed as viable because it had operated successfully for many years in southern Ireland, and appropriate because it is a transparently ‘fair’ system – one that gives parties seats in direct relation to their votes, unlike the huge distortions with plurality rule voting (retained in Northern Ireland only for Westminster elections).
Because STV lets voters choose to support candidates across party lines, British leaders also hoped that the system would encourage Northern Ireland voters to endorse ‘moderate’ people rather than sectarian extremists, and to support newer parties (like the Alliance) that were non-sectarian.By and large these effects have not materialised. The moderate Protestant party, the Ulster Unionists (UUP), lost ground gradually to be displaced by the initially more vigorously Protestant, Democratic Unionist Party (DUP). Sinn Fein, the more radical Catholic-backed party with links to the IRA tradition, gained ground, while votes for the more ‘moderate’ Social Democratic and Labour Party (SDLP) declined over time. The alliance and other cross-sectarian parties survived, but their vote share remained small, and ‘cross-voting’ across sectarian lines has been relatively rare.
Still STV elections for the 108 seats Northern Ireland Assembly have been successful in creating the basis for a development towards peaceful coexistence and a degree of co-sovereignty of the UK and Irish Republic in Northern Ireland. The accurate seats shares are important in constituting the power-sharing Northern Ireland Executive also in a proportional way. The party with most seats gets the first pick of ministerial positions, the party with second most seats the second pick, and so on. STV also applies to local elections, initially operated in 26 districts (whose boundaries slightly favoured the DUP). In 2014 the first elections took place on new boundaries for the 11 larger and modernised districts.
STV elections spread to mainland Great Britain in 2006, when the Labour Party allied with the Liberal Democrats in the Scottish Parliament to reform the voting system for Scotland’s local authorities. The Liberal Democrats have been long-time advocates of STV as the most proportional voting system. The SNP accepted the reform, but were not that interested at first – ironically for it later proved to be crucial for them in opening up entrenched Labour municipal strongholds for their councillors. Even though STV requires very much larger council wards (in order to elect multiple councillors), and some of these wards in low-population parts of the Highlands proved to be vast areas indeed, the radical change went through.
The first Scottish local government elections using STV took place in 2007. Many voters were confused then because the AMS elections for the Scottish Parliament and the STV elections for councils were held simultaneously (which Labour felt would maximise their chances). On a high turnout of 53%, Labour and the SNP were neck and neck in terms of votes, with Labour slightly ahead despite losing 4% of its vote share. The seats allocations placed the SNP ahead, however, and the party made major advances in its local visibility.
The second set of Scottish STV elections were held in May 2012, and with no Scottish Parliament elections on the same day turnout fell to 40%. The SNP and Labour were again close in the lead in popular vote terms, and both gained seats, often from the Liberal Democrats (unpopular because of their Westminster coalition with the Tories). The results were highly proportional, with the SNP, Independents and Labour somewhat over-represented at a national level, and the Conservatives, Liberal Democrats and Greens somewhat under-represented. But these effects were very small-scale.
The two STV results helped to fuel the SNP’s build-up of its party machine, with its many new councillors since 2007 playing leading roles in the party’s 2014 referendum campaign on leaving the UK. Labour’s local party machine went into something of decline for a time, without large numbers of erstwhile councillor-activists to sustain it, setting the scene for the party’s wipe-out losses to the SNP at the 2015 Westminster general election.
The 2017 STV elections were held a month before the Corbyn surge at the general election, with a higher 47% turnout. The SNP votes and seats stayed steady, but there was a 12 percentage point surge of Conservative support at Labour’s expense. Labour lost another third of its Scottish council seats, while the ascendant Conservatives under Ruth Davidson gained 146% more seats, and moved into second place in terms of councillor numbers.
Strengths, Weaknesses, Opportunities, Threats (SWOT) analysis
| Current strengths | Current weaknesses |
|---|---|
| STV is a clearly proportional voting system when operating in UK conditions, and mostly works very well to match party seats and votes. | Even with large multi-member constituencies, some smaller constituencies may rather randomly not represent all parties (e.g. a three or four-seat constituency in a five-party system). |
| In theory it offers voters the chance to move popular candidates up party lists of who gets elected, (and perhaps move down unpopular candidates that parties have ranked high). In practice, most voters follow party rank orderings. | The counting process in STV is complex and hard to explain to citizens, potentially endangering its legitimacy. |
| STV does not necessarily promote diversity. For example, the proportion of women councillors in Scotland was a low 22% in 2007, and grew only a little to 24% in 2012. | |
| In Northern Ireland STV has not had as much impact as UK elites hoped in encouraging voting across sectarian dividing lines. |
| Future opportunities | Future threats |
|---|---|
| The STV system seems well-established, and its results are well accepted. | Some smaller English authorities with an executive may revert back to a council system in local referendums. |
| As citizens become more familiar with voting using STV there is the potential for it to be used more widely for other UK elections | Turnout in the Northern Ireland Assembly elections has declined from 70% in 1998 to 54% in 2011 and 2016. In Scotland it has declined from 60% to 40% in 2012 and 47% in 2017, raising questions over whether the more complex electoral system deters voters. |
How proportional is the Single Transferable Vote in UK conditions?
We noted in the plurality rule post that DV scores for FPTP have averaged 22.5%. Table 1 below shows that both the Northern Irish Assembly and the Scottish system have performed three times as well. In fact, all these elections show overall DV scores almost as low as it is feasible to get at 6.8 and 7.5% (while probably the lowest possible score would be 5%). The Northern Ireland council result in 2014 was considerably less proportional, however, under the new local government boundaries. This largely reflected the poor success of small parties and independents, who gathered nearly one in eight votes in all, but fragmented across too many candidates to let them win seats.
Table 1: The deviation from proportionality of STV elections in Scotland and Northern Ireland
| Date | Election | DV score % |
|---|---|---|
| 2014 | Northern Ireland councils | 11.1 |
| 2012 | Scottish local government | 7.5 |
| 2011 | Northern Ireland Assembly | 6.5 |
| 2011 | Northern Ireland councils | 4.5 |
| 2007 | Scottish local government | 7.5 |
The List Proportional Representation System for electing the UK’s MEPs
Used for: choosing the 73 UK members of the European Parliament (MEPs)
How it works: The country is divided into 13 regions, ranging in size from the South East (10 seats) and London (8 seats) down to the North East and Northern Ireland (3 seats each). The main parties all selected enough candidates to contest all of a region’s seats, while smaller parties could only contest some of the available seats. The parties arranged their candidates on their list, so candidates that are placed at the top would win seats first if their parties get enough support. The ballot paper showed each party’s list and voters chose just one party to support using a single X vote.
All the votes in each region were then counted and each party got seats in proportion to the party’s vote share. So, suppose we had a region with 10 seats where party A got 40% of the vote – they should have ended up with four of the available seats. This system is very proportional but it may favour larger parties if votes are heavily fragmented across many smaller parties. List PR is also used widely across Europe for electing national parliaments, as well as the European Parliament (EP).
Recent developments
The List PR system was first introduced in 1999 as a result to twin pressures – from the EU to put in place more standardised PR elections for the European Parliament; and a ‘constitutional pact’ between Labour and the Liberal Democrats, signed just before the 1997 general election. The scheme was drawn up by the UK civil service for 86 seats using standard regions as multi-seat constituencies
In 2004, 2009 and 2014 EP elections took place one year before general elections. In all these years, support for the UK Independence Party surged and that for the Conservatives and Labour took a big hit. And because this is a PR system, UKIP’s large vote shares converted into seats well, especially in 2014.
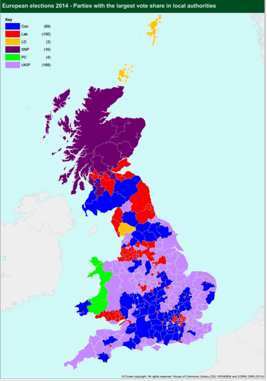
Chart 2: The largest party in the 2014 European Parliament elections, by local authority area
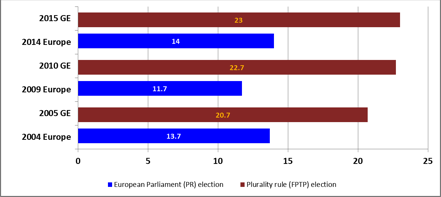
This pattern plays a significant role in explaining why the Conservatives felt pushed into conceding the EU referendum in an attempt to insulate their general election vote from UKIP. UKIP, however, were considerably disadvantaged in the Westminster elections by the first past the post voting system. Chart 3 shows the alternation of proportional List PR EP elections, with disproportional FPTP general elections.
Chart 3: The deviation from proportionality (DV%) of European Parliament and general elections
The referendum decision to leave the EU means that the List PR system will no longer be used for the foreseeable future in the UK.
Strengths, Weaknesses (SW) analysis
| Current strengths | Current weaknesses |
|---|---|
| The system is simple to use. Voters mark one X for their first choice party. | The system is a ‘closed list’ one, where the political parties completely control the order in which candidates get elected from their list. Voters therefore cannot influence this at all. |
| The system is straightforward to count at the large regional scale and it is relatively easy for voters to understand how votes convert to seats. | Allocating seats follows the d’Hondt method, which somewhat favours the larger parties in the election, over smaller ones. |
| The system was used for five elections and no major public criticisms of the system have emerged. | The UK’s number of seats in the EO has been reduced over time, with seats being removed in a rather ad hoc manner from regions, in only rough relation to their population. |
| With only 3 seats each, the two smallest regions are too small, and only the top three parties can secure representation there. The north-east of England could be merged into one of its neighbouring regions, but Northern Ireland is an intractable case. | |
| MEPs in the UK are very little known by citizens. Some critics allege that the large regional constituencies contribute to this ‘isolation’. But it seems more likely that the UK’s very inwardly focused media dynamics are to blame. The 2016 vote to leave the EU could also be interpreted as a challenge to MEPs' legitimacy, if not necessarily the system used to elect them. |
Conclusion
The adoption of proportional electoral systems in the UK has shown that PR can work effectively under British political conditions, and that they are undoubtedly more effective at converting seats into votes than FPTP. That said, they are not without their weaknesses. Both systems still tend to favour larger parties and STV in particular is potentially more confusing, due to the fact voters have to rank their choices with numbers and the complicated counting process.
There is increasing support for PR systems in the UK. However, Conservative resistance and the fact that the electorate voted against electoral reform in 2011 mean the use of PR is unlikely to be expanded in the foreseeable future.
This post does not represent the views of the London School of Economics or the LSE Public Policy Group.
Patrick Dunleavy is Professor of Political Science and Public Policy at the LSE, co-director of Democratic Audit and Chair of the Public Policy Group.
![]()
Similar Posts
Subscribe
If you enjoyed this article, subscribe to receive more just like it.


 Democratic Audit's core funding is provided by the Joseph Rowntree Charitable Trust. Additional funding is provided by the London School of Economics.
How democratic are the UK’s two fully proportional electoral systems? https://t.co/1nVe1HUbpc
How democratic are the UK’s two fully proportional electoral systems? https://t.co/76ZqgUYRv9
@democraticaudit Scottish AMS also not as good as it could be: SNP got maj. seats on min. vote in 2011. (In both party and constit votes.)
.@democraticaudit 5 seat STV in Tasmania & Aust Capital Territory rotates candidate names so voters determine who wins quotas. No safe seats
The basic premise at the head of this article is incorrect.
“It should accurately translate parties’ votes into seats in the legislature”. This is NOT agreed as essential for a democracy.
A more appropriate condition could be:
“It should broadly reflect the views/opinions/concerns of the
electorate in the composition of the resultant legislature”.
Existence of “parties” is NOT essential to democracy.
Thus the remainder of the article fails to take a sufficently wide
view of the merits of systems which do not put parties at the
core of their being.
Interesting that the DV in STV is a lot less on average that the PR list system!
How democratic are the UK’s two fully proportional electoral systems? https://t.co/mVmcDWRBd4 https://t.co/6tTJ0ukIqN