The UK’s 2019 European Parliament elections are happening after all. Here’s how they will work
All EU member states will hold elections to the European Parliament between 23 and 26 May. Since the UK has now extended its membership of the EU beyond this date (and possibly until the end of October), these elections must also happen here on Thursday 23 May. The UK elects 73 Members of the European Parliament (MEPs) by a proportional representation (PR) system, to represent 9 English regions, Scotland and Wales, and using the STV system in Northern Ireland. The Democratic Audit team explains how this election works, what will be on your ballot paper, and what we know so far about party prospects. In the run-up to the election we will preview the contests in your area in more detail.
European Parliament. Picture: European Parliament/(CC BY-NC-ND 2.0) licence
Since 1999 the UK has used a proportional representation system to choose MEPs on four occasions, the last one being 2014 when UKIP surged to top of the poll in England and Wales, pushing Labour and the Conservatives into second and third place, and winning UKIP an unprecedented 24 seats. Times have changed, however, since UKIP collapsed into leadership furores after the June 2016 Brexit referendum, and most of their MEPs no longer sit for the party. Eight are with Nigel Farage in a new Brexit party. Meanwhile, of course, the Brexit process has been prolonged and convoluted, with the UK shooting past two exit deadlines already, over six million people petitioning to revoke UK’s withdrawal altogether, and Parliament repeatedly deadlocked over what kind of Brexit it wants to achieve.
The last thing Theresa May wanted was to have to re-elect the UK’s MEPs and run the gauntlet of Brexiteers’ and Remainers’ dissatisfactions with the process. But that is what will now have to happen. Results will not be known until Sunday, 26 May, when all European Parliament election results are released at the same time.
All UK citizens, qualifying Commonwealth citizens, and citizens of the other 27 EU countries resident in the UK and aged over 18 on election day can vote in these elections. The deadline for voter registration is 7 May, and you can register here.
How the PR electoral system works
Elections for the European Parliament use a List PR system of voting, where everyone gets to cast a single vote for the party of their choice, and MEPs are elected in multi-seat regional constituencies, with seats allocated to parties in proportion to their share of the votes. There are 11 regions in mainland UK, ranging in size from the South East (ten seats) and London (eight seats) down to the North East (three seats). The main parties all select enough candidates to fill all of a region’s seats, while smaller parties may only stand candidates to fill some of the available seats. The party sets the order in which their candidates will appear on the party list on the ballot – so the system is called List PR. If a party gains enough support to win a seat, the candidate at the top of that party’s list is elected. In large regions, candidates lower down the list can also get elected, if the party gains enough support. (However, in Northern Ireland the Single Transferable Vote or STV system is used for its three seats.)
At the polling station, voters are given very large ballot papers like that in Figure 1. You cast a single vote by marking an X in the box of the party that you most prefer. As with Westminster elections you can only back one party, but then the process for determining which candidates are elected is quite different.
Seats are allocated to the parties in proportion to their vote share in each region. Suppose we had a region with ten seats where party A got 40% of the vote – they should end up with four of the available seats. During the vote count, seats are allocated to parties in rounds. The first seat in a region goes to the party with the largest vote share. This party’s total votes is then divided by two, and the next seat goes to the party with the largest number of votes remaining after this division. This process (whereby a party’s votes are divided by the number of seats they have gained in previous rounds+1) continues through all allocations. This formula for allocating seats is known as the d’Hondt system, and is generally proportional in large regions, but less so in regions with few seats. If a lot of votes are heavily fragmented across many smaller parties, none of whom has enough support to win a seat, then the system may also help the big parties. Smaller parties also have a better chance of gaining a seat in the larger regions that elect more MEPs, as the vote share needed is less.
Figure 1: Sample section of a ballot paper
Source: https://www.legislation.gov.uk/ukdsi/2013/9780111101223; Note: candidate names are illustrative only
The 2014 European election results and current MEPs
In 2014 (as in 2009 and 2004 before that) the UK’s MEPs were elected a year before a subsequent general election, in contests where UKIP (and sometimes other very Eurosceptic parties) performed far better than at Westminster elections. Figure 2 shows the results from 2014, when UKIP pushed the two major parties into second and third place and won the largest share of seats. The map in Figure 3 shows which parties won how many seats in each region.
Figure 2; The results of the 2014 European Parliament elections across the UK(showing the 12 largest parties, ten of which won seats, plus smaller parties)
| Party | Millions of votes | % of votes | Seats | % of seats |
|---|---|---|---|---|
| UK Independence Party | 4.37 | 26.6 | 24 | 32.9 |
| Labour Party | 4.02 | 24.4 | 20 | 27.4 |
| Conservative Party | 3.79 | 23.1 | 19 | 26 |
| Green Party (England & Wales) | 1.14 | 6.9 | 3 | 4.1 |
| Liberal Democrats | 1.09 | 6.6 | 1 | 1.4 |
| Scottish National Party | 0.39 | 2.4 | 2 | 2.7 |
| Sinn Féin | 0.16 | 1 | 1 | 1.4 |
| DUP | 0.13 | 0.8 | 1 | 1.4 |
| English Democrats | 0.13 | 0.8 | 0 | 0 |
| Plaid Cymru | 0.11 | 0.7 | 1 | 1.4 |
| Scottish Green Party | 0.11 | 0.7 | 0 | 0 |
| Ulster Unionist Party | 0.08 | 0.5 | 1 | 1.4 |
| 16 smaller parties | 1.03 | 5.5 | 0 | 0 |
| Total | 16.55 | 100 | 73 | 100 |
Figure 3: Map of European Parliament 2014 election results by region
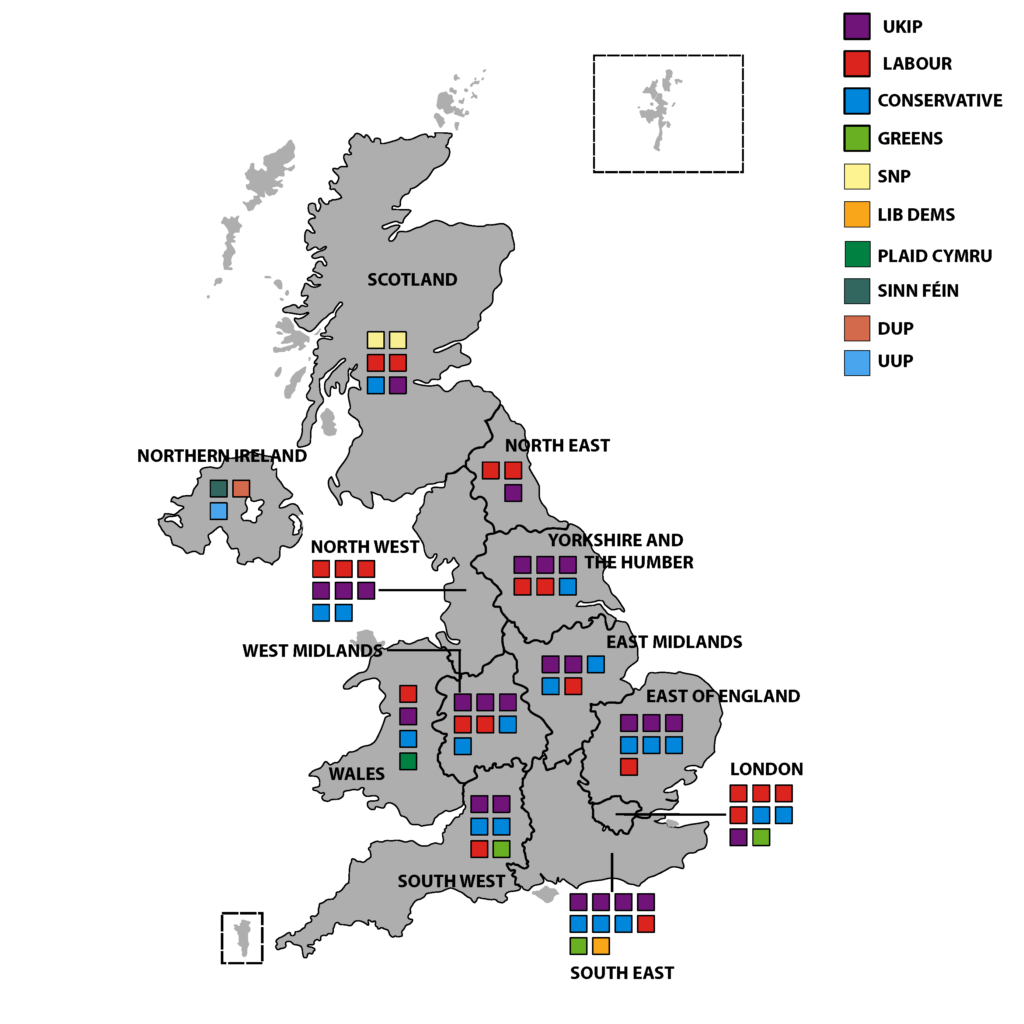
Source: Adapted from Wikipedia
You might think therefore that UKIP will have the most incumbent MEPs ready and able to stand in the new 2019 elections. However, there are complications with any List PR system. If an MEP stands down from the European Parliament between elections, the party for which they originally were a candidate is allowed to nominate a replacement MEP, without calling an election. The person chosen is usually a candidate from further down their party list, but the party can decide who it will be. Since 2014, there have been 10 such replacements for MEPs from the UK (one UKIP member, five Conservatives and four Labour Party MEPs).
The big problems arise if the sitting MEP leaves the party they stood for, or defects to another one. In this case, they can remain as an MEP, despite having been originally elected on a different party’s list. Since 2014, 19 of the UK’s MEPs have left their original party. Of the 24 UKIP MEPs elected in 2014, only seven remain members of the party, and 17 have left. Eight, including Nigel Farage, are now members of his new ‘Brexit Party’; seven sit as Independents (another one, Steven Woolfe, has also said he will join the Brexit Party); one (Amjad Bashir) defected to the Conservatives; and one (Patrick O’Flynn) is now a member of the SDP. In addition, two Conservative MEPs (Julie Girling and Richard Ashworth) had the whip removed for voting along pro-European lines in the EU Parliament.
Because the 2019 elections are being scrambled together at the last minute, and parties are consequently rushing to find candidates to stand for what may be six months or less of the UK’s remaining membership of the EU, it seems likely that Labour and Conservative parties will encourage incumbent MEPs to re-stand. However, many MEPs are not well known in the UK, so any ‘incumbency benefit’ they gain may be limited. The deadline for parties to confirm their candidates is 25 April (24 April for the South West region).
How will the parties fare in 2019?
With elections being called in the midst of the on-going Brexit crisis, and at short notice, there remains considerable uncertainty about outcomes. The electoral collapse of UKIP since the 2016 Brexit referendum is likely to have the biggest effect on seat allocation across mainland Britain compared to the 2014 results. In 2014, they achieved the highest vote share at 27.5%, but at the last general election in 2017 they polled just 1.8%. Initial polling indicates they could see some resurgence (see Figure 4), with strong support for Brexiteer parties. One complication is any split in the ‘extreme’ Brexit vote between UKIP, led by Gerard Batten, who has taken the party in a virulently anti-Islam direction and allied with Stephen Yaxley-Lennon (Tommy Robinson); and Nigel Farage’s new party, the Brexit Party, which ostensibly has eight incumbent MEPs, who all defected from UKIP. This may impede their abilities to win seats if they both stand in some or all regions.
Figure 4 shows one recent poll which Labour as the largest party in all regions of England and Wales, whereas in Scotland the SNP was in a strong lead. Respondents showed strong support still for UKIP in an EP elections, despite the party’s well-known leadership difficulties since June 2016. The poll also did not include Farage’s new Brexit Party, so it perhaps makes sense to see the UKIP support here as likely to split across UKIP and any Brexit party candidates. Other recent evidence suggest broadly similar results, with an online poll for Hanbury Strategy finding that Farage’s Brexit party would take 10% support to UKIP’s 8% if both stand.
Figure 4: Percentage support for parties in a hypothetical European Parliament election, in a late March 2019 survey
| Labour | Conservative | UKIP | Lib Dem | Green | SNP/PC | Other | |
|---|---|---|---|---|---|---|---|
| London | 38 | 18 | 13 | 8 | 17 | 3 | 3 |
| North England | 38 | 27 | 16 | 11 | 6 | na | 2 |
| Midlands | 32 | 26 | 24 | 7 | 4 | na | 7 |
| Wales | 29 | 14 | 21 | 13 | 3 | 19 | 1 |
| South England | 28 | 24 | 18 | 12 | 11 | na | 6 |
| Scotland | 17 | 18 | 13 | 4 | 4 | 37 | 6 |
| All UK | 30 | 24 | 18 | 10 | 8 | 5 | 5 |
Source: Opinium/Observer (fieldwork 28 & 29 March) . Question: “And if the UK were to participate in the 2019 European Parliament elections which party would you vote for to be your MEP?”
Notes: The % numbers above exclude ‘Don’t Know’ and ‘Would Not Vote’ respondents. The % shares for Wales must be treated with particular caution as the sample is N=70.
In the past, the List PR electoral system used to choose MEPs has helped smaller parties to look more viable at these elections, and encouraged some voters to give them a try. Pro- and anti-Brexit cleavages now cut across both the Conservative and Labour parties, and ‘Remainer’ and ‘Leaver’ identities have become more entrenched in the electorate since 2016, compared with party allegiances. Voters may also use the EP elections as a way of expressing dismay at or impatience with the UK’s prolonged Brexit process.
Others who might possibly do better include the new Change UK party if they stand (this the new party formed by the Independent Group of breakaway MPs), who received 4% in one poll, possibly the Greens, and Plaid Cymru. For instance, Figure 4 shows the Greens with unusually strong support in London – although this is not replicated in other polls. Despite their clear ‘Remain’ stance, the Liberal Democrat support remains in the doldrums (although up on their 2014 vote share).
Perhaps the biggest uncertainty surrounds how many people will actually vote in the European Parliament elections. Will the six million people who signed the petition to revoke (withdraw) Article 50 be the more motivated to come out and convert their protest into votes? Or will there instead be a surge of Brexiteer support to show the popular disgust at the behaviour of MPs that the Brexit-backing tabloids repeatedly claim exists? Or will voters at large conclude that any MEPs will only sit in Brussels and Strasbourg for six months over the summer holidays anyway, and so the election does not matter at all – hence staying home in larger than ever numbers?
Nearer the election date, we will bring you more detailed guides to the elections in all regions, as it becomes clear who is standing for which party, and as more polling information becomes available. We will also feature European Parliament election information on our Democratic Dashboard. Meanwhile local elections on 2 May in parts of England and across Northern Ireland may also give some indication of how the parties are faring on the ground in different regions – although in England they are only occurring in some areas. The English local contests also use the first-past-the-post electoral system, so they may not shed too much light on how voters will behave in a proportional representation election three weeks later.
Similar Posts
Subscribe
If you enjoyed this article, subscribe to receive more just like it.


 Democratic Audit's core funding is provided by the Joseph Rowntree Charitable Trust. Additional funding is provided by the London School of Economics.
_(United_Kindgdom).svg)
[…] had again been redefined in UK law and was now 31 October 2019 at 11.00 pm, providing that elections for the European Parliament were held in the UK on 23 May 2019. In her response on 11 April to a written question to the […]
[…] The UK’s 2019 European Parliament elections are happening after all. Here’s how they wil… Democratic Audit UK […]
Very clear, thank you.
[…] The UK’s 2019 European Parliament elections are happening after all. Here’s how they wil… Democratic Audit UK […]