Unless we change the way we think about transparency, open data is unlikely to have a significant political impact at the local level
Open data and transparency have long been heralded as welcome innovations by policymakers and politicians, and the current Government has made it a priority at both a national and local level. But when it comes to the latter, how effective has it been and how much have citizens made use of it? Mark Frank argues that local authorities continued use of the ‘passive transparency’ model threatens to limit the potential of open data and transparency.

Credit: LeRamz, CC BY NC SA 2.0
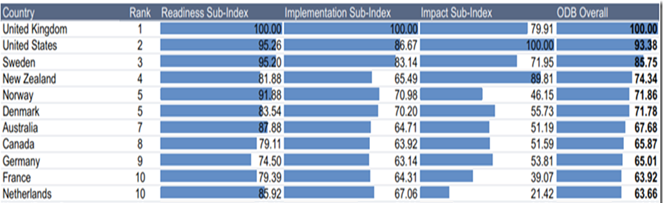
Over the course of the last decade governments round the world have been extolling the virtues of open data, which means publishing a wide range of government data on the web for anyone to view and reuse without financial, legal or technical restrictions. Open data differs from Freedom of Information legislation because it is proactive not reactive – data is published without being asked. The coalition government supported this policy enthusiastically and the UK is ranked as number one in the world for prevalence and impact of open data according to the Open Data Barometer
Chart 1: Country Rankings according to the Open Data Barometer 2013.
Many benefits have been claimed for governments publishing open data, one of the most important is that it increases transparency and thus makes government more accountable and efficient (a concept which goes back at least to Jeremy Bentham). Clearly this message appeals to a government committed to reducing public expenditure and the role of the public sector. As David Cameron put it shortly after coming to power in 2010:
“With a whole army of effective armchair auditors looking over the books, ministers in this government are not going to be able to get away with all the waste, the expensive vanity projects and pointless schemes that we’ve had in the past.”
This policy applied equally to local government. A few weeks later Eric Pickles, then the Secretary of State for Communities and Local Government (DCLG), announced a list of “recommended” datasets for local authorities to publish, known as the Local Government Transparency Code. Almost every primary and secondary authority in the country conformed to the recommendation. In 2014 the list was expanded and authorities were required to publish the expanded list by law.
So has publishing open data made authorities more transparent? It depends on what you mean by transparency. In 2011 Antti Halonen of the Finnish Institute in London surveyed local authorities on the new policy with results that he summarised as “in theory yes, but in practice no”. The main problem being that the data were largely ignored:
“It depends on how you define successful. While we have produced the data, there appears to be minimal interest in it.”
In 2013 Ben Worthy of Birkbeck College, London conducted another survey of local authorities which confirmed this conclusion. 60% of the authorities reported use as low or very low.
This message is further confirmed by my own research. In 2014 I explored several local authorities’ use of open data – interviewing politicians, officers and users. One authority in particular clearly illustrated the situation. This authority was among the first to publish of open data and helped set the standards for the transparency code. There was no doubting the commitment to transparency throughout the organisation. Yet, usage is low, as one officer explained:
“There are people like the armchair auditor … but they are pretty far and few between at the moment”
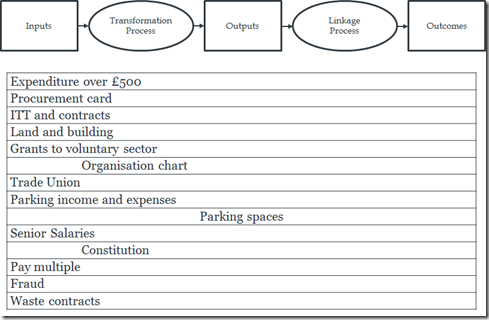
There are a couple of reasons why this is not surprising. One is the nature of the data. The transparency code emphasise data on expenditure (invoices over £500, senior officers salaries, details of contracts etc). This type of data provides what David Heald calls input transparency – information about the resources the authority uses to provide services. While input transparency may appeal to a government cracking down on public expenditure and waste, most citizens are more interested in what Heald calls output and outcome transparency i.e. what services the authority delivers and what effect those services have.
Parents care more about the lessons their children receive and how educated they are as a result than about how much the authority spends on teachers’ salaries. Even those citizens who are keen to monitor inputs will presumably want to relate those inputs to outputs and outcomes. As chart 2 below shows, there is only one dataset in the transparency code that could be reasonably be described as output transparency (number of parking places) and none that could be described as outcome transparency.
Chart 2: Mapping the Data Transparency Code Against Heald’s Types of Transparency
The other reason is that authorities publish the data but make little effort to promote it. It is not easy to find the data on most authorities’ websites – much less understand it. As an officer explained:
“….I wouldn’t say we have necessarily been overt about publicising it either. So I think it has largely been driven by trying to make our lives easier in terms of requests rather than being overt about publicising that things are there”
Many authorities make a public commitment to transparency, and, at least for this case study, this was a genuine commitment. Councillors would regularly challenge officers to publish data unless there was good reason not to. As a result the authority published many more datasets than were required under the code (over a 100 at the last count). Nevertheless the vast majority of datasets were input data and there was little effort to promote them. I concluded that this arises from their concept of transparency – what Frederick Schauer calls passive transparency and Richard Oliver calls old transparency. Passive transparency is the view that transparency means making information about government available. Government should not concern itself with who uses that information or for what purpose. It is not required, or appropriate, for government to promote that information or interpret the information. The metric of passive transparency is the amount of information that is made available – more is better. As the leader of the authority said when asked about the low usage of open data:
“there are books in libraries that don’t get borrowed for years and years, but then someone will want it someday”
Active transparency regards transparency as an act of communication to an audience. A great example is targeted transparency programmes such as requiring restaurants to display stickers with the results of food hygiene inspections. Active transparency involves defining a problem to be addressed, identifying an audience to be informed, selecting information that is to be communicated and putting in place the socio-technical systems to communicate successfully and allow the audience to act on the information. Clearly open data can be part of active transparency but it requires a lot more than making data available. It may even require creating the data needed to address the problem e.g. through a survey or an inspection programme.
Open data is closely linked to passive transparency. Success is typically measured by the amount of data that is published – governments and departments make much of the number of datasets – and the golden rule is all data should be published unless there is good reason not to. Many writers strongly resist the idea that government should select or interpret the data. It is not surprising that the result is mostly input transparency. Input data is on the whole easier to obtain and publish than output or outcome data. It is easier to track how much you have spent on teachers than the number of lessons they have taught or how well educated children are as a result. There are signs that this changing. The national information infrastructure is a government initiative to select datasets based on users needs that are key to the nation and demand special attention. But the passive transparency model remains dominant and while it does open data is unlikely to have a significant political impact.
—
This post represents the views of the author and not those of Democratic Audit or the LSE. Please read our comments policy before posting.
—
 Mark Frank is PhD student at the University of Southampton. His Southampton web page can be found here.
![]()
This post is based on a presentation given by the author at the 2015 CeDem conference in Krems, Austria.
Similar Posts
Subscribe
If you enjoyed this article, subscribe to receive more just like it.


 Democratic Audit's core funding is provided by the Joseph Rowntree Charitable Trust. Additional funding is provided by the London School of Economics.
[…] possess ways to say they are supportive of transparency but not actually practice it. Mark Frank writes for Democratic Audit UK that many governments, even those in the UK and the U.S. which are ranked at the top of […]
[…] Read the story in Democratic Audit UK […]
Change how you think about #transparency, so #opendata can have a significant local impact -by @Mark_T_Frank https://t.co/3wRcnfzQAn #ukblc15
“Unless we change way we think about transparency, #opendata unlikely to have local political impact”
https://t.co/344nAHWH7u
h/t @jaCattell
RT @democraticaudit: Unless we change the way we think about transparency, open data is unlikely to have a significant political impact htt…
Unless we change how we think about transparency, open data won’t have significant political impact at local level. https://t.co/WxqvoYDn4r
Changing #transparency thinking, so #opendata has political impact in #localgov – by @Mark_T_Frank https://t.co/3wRcnfRrYX
What a lot of us care about is transparency in decision making. Ensuring all the information needed to consider the options is available, that the agendas are openly stated, debate is full and frank etc. rather than secretive and possibly corrupt.
What a lot of us care about is remarkably in decision making. Ensuring Ali the information needed to consider the irons is available, that the agendas are openly started, debate is full and frank etc. rather than secretive and possibly corrupt.
Remarkably = transparency
Unless we change the way we think about transparency, #opendata is unlikely to have a significant political impact https://t.co/khIDvmDAux
[…] This piece originally appeared on Democratic Audit. […]
We need to change the way we think about transparency for #opendata to have political impact at local level https://t.co/p6KUeq6Bos
‘Passive transparency’ model threatens to limit potential of #opendata , says @Mark_T_Frank https://t.co/b5dHgmyP31 HT @democraticaudit
What’s the link between #OpenData and political change? https://t.co/cj9y8uSD1w via @democraticaudit
Unless we change how we think about transparency, #opendata will not have significant impact at the local level https://t.co/CfbtIy4zhN
Unless we change the way we think about transparency, open data is unlikely to have a significant political impact https://t.co/LgdTaPlK8k
#Localgov’s continued use of ‘passive #transparency’ model threatens to limit the potential of #opendata https://t.co/LATOiq1R9q | Mark Frank
Unless we change the way we think about transparency, open data is unlikely to have a significant political impact… https://t.co/3qw8CG8QSH
I personally think that a lot of the accounting or finance jargon needs to be improved to make a larger impact at the local level. As it stands ease of access and understanding is not as good as it should be. The local public need to fully understand how to access the data and be encouraged to do so. This should be linked to pain English publications, or such like, during rate setting time or other such periods when the public interest is high.
It should always be very clear what each member of the public receives in exchange for paying their taxes.
#opendata is unlikely to have a significant local political impact at the local level without rethinking transparency https://t.co/RFkqG6Sx3N
Unless we change the way we think about transparency, open data is unlikely to have a significant political im… https://t.co/vud3WBJ5fq
Unless we change the way we think about transparency, open data is unlikely to … – Democratic Audit UK https://t.co/mAJa2ORkZW #opendata
Unless we change how we think about transparency, open data won’t have a significant political impact at local level https://t.co/VPcIYY77iL
Unless we change the way we think about transparency, open data is unlikely to have a… https://t.co/j0oeqt619L https://t.co/zZMmqTnZRi