A new method for addressing parliamentary boundaries shows the extent of Britain’s “safe seat” problem
With the the 2015 election upon us, there is much talk of safe and marginal seats, and the main parties approach to each. In this post, Max Goplerud examines a perennial concern about the British electoral system—the prevalence of safe seats—using historical data and a new method for addressing boundary changes to illustrate the extent of the problem.

Election night surprise? (Credit: ceellanr, CC BY 2.0)
The Electoral Reform Society, amongst others, has periodically noted that many voters are currently located in ‘safe seats’, i.e. ones in which the incumbent’s majority is so large that they are, effectively, guaranteed re-election. For the upcoming election, they suggest that over half of seats (364 out of 650), covering 25.7 million people, are ‘ultra-safe’, and thus the outcome in those seats is basically certain.
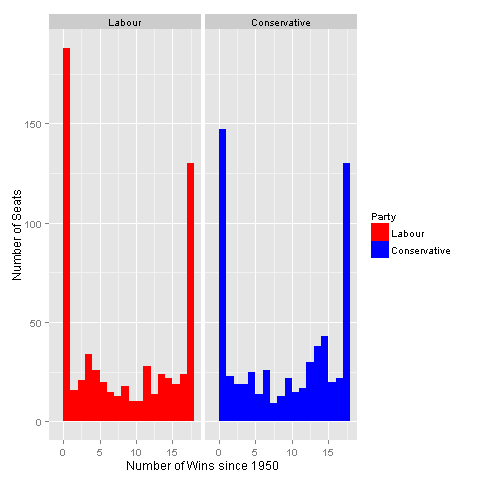
I use a programme written for my working paper to demonstrate the magnitude of this problem in a different way. Using the method described at the end of the blog (with several caveats!), I projected constituency-level results at every election from 1950 onto the 2010 boundaries. It provides a stark illustration of the number of ‘ultra-safe’ seats. Focusing on the 632 British constituencies, my method suggests that the same party would have won in 41% of seats at every election since 1950. Labour and the Conservatives each have 130 such seats, with the Liberal Democrats having only one (Orkney and Shetland). If I allow up to two ‘blips’ (e.g. a different party winning), this figure rises to 55%! From a different perspective, the data show that Labour and the Conservatives would have always lost in a sizeable number of seats (30% and 23%, respectively). The figure below plots the distribution of number of ‘wins’ since 1950 for each party.
How to fix this problem
Fixing this problem of uncompetitive seats is complicated, and an effective solution might require radical change. Two commonly discussed solutions to this are likely inadequate. First, using the Alternative Vote (AV) is unlikely to fix this problem; parties that can win a crushing victory under the current constituency boundaries will likely continue to do so under AV, though perhaps after some redistribution of smaller party preferences.
Second, drawing ‘better’, i.e. more balanced, boundaries in a systematic fashion is also likely unworkable. It seems risky and short-sighted to require the Boundary Commissions to (formally) consider political composition when making proposals, as this might undermine their current (mostly) non-partisan reputation. Moreover, the logistics of creating many ‘balanced’ constituencies would almost certainly require splitting local communities and merging tangentially related areas. In general, I suspect solution to this problem almost certainly requires moving away from single member electoral districts; others on this blog have outlined the wide range of alternatives that exist.
Projecting Results across Boundary Changes
The method used above is an alternative to the commonly used ‘notional results’ from two academics at the University of Plymouth. My method does not seek to challenge or displace theirs, as their results are widely used and are agreed to be of a good quality! Unfortunately, however, their method only permits projection of the election immediately before and after a boundary change. Thus, one cannot project data across multiple changes (e.g. 1992 on 2010), most non-consecutive years (e.g. 1987 on 1997), or for changes before 1979.
I avoid such problems by making the crucial simplifying assumption that, conditional on population, the vote for each party is evenly distributed throughout a parliamentary constituency. I estimate population transfers from the old to new constituencies using spatial representations (shapefiles) of constituencies and census data; for example, 30% of the population of (old) constituency X is included in (new) constituency A. Using the assumption of a uniform distribution, I then transfer the votes for each party proportionally, e.g. 30% of the vote for party 1 in constituency X is included in (new) constituency A’s total. This method allows the easy projection of any variable using any arbitrary set of boundaries.
 Yet, as that simplifying assumption is obviously false, verifying the method’s accuracy is crucial. I compared my results against the official ‘notional results’ for the last three boundary reviews. The results are very good; looking at those seats that experienced non-trivial change, the methods predict the same winner in 90% of cases and the absolute average difference is around 3%.
Applying my method to boundary changes in five other countries (Australia, Canada, Germany, New Zealand, and the United States) returns similarly good results; the absolute average error (compared against the actual result) is around 2-3% and it correctly predicts the first-placed party in over 90% of cases.
—
This post represents the views of the author, and not those of Democratic Audit or the LSE. Please read our comments policy before posting.
—
 Max Goplerud is a student in the Department of Politics and International Relations at the University of Oxford (Nuffield College). He has previously worked at UCL’s Constitution Unit.
Similar Posts
Subscribe
If you enjoyed this article, subscribe to receive more just like it.


 Democratic Audit's core funding is provided by the Joseph Rowntree Charitable Trust. Additional funding is provided by the London School of Economics.
The rules of the Boundary Commissions do not help. Borough seats have large Wards and County seats smaller ones. Whilst the Commissions are not allowed to divide the larger borough wards so leading to greater problems for redistribution in urban areas and wider disparity of electorates. They ought to be allowed to use polling district boundaries to assist the re-alignment of constituencies in borough constituencies. All constituencies electorates ought to be within a narrower band of tolerance. I speak as one who has dealt withthe outcome of boundary commission reviews over many years.
A new method for addressing parliamentary boundaries shows the extent of Britain’s “safe seat” problem https://t.co/lk9QYDfiRf
A new method for addressing parliamentary boundaries shows the extent of Britain’s “safe seat” problem https://t.co/ZG0WtjKAv0
A new method for addressing parliamentary boundaries shows the extent of Britain’s “safe seat” problem https://t.co/GryGW4hHi8