In comparative league tables of liberal democracies the UK’s democracy is judged to be First Division, but not Premier League
Ranking established liberal democracies against countries that are still developing a democratic polity risks awarding the long-lived countries ‘ceiling’ scores at the top of the table – feeding complacency amongst their elites and domestic publics that they can now rest easy on their laurels. However quantitative rankings typically do not treat the UK in this manner. Instead they assign it to a ‘good but not great’ category, well behind the states leading democratic good practice. For our new book, The UK’s Changing Democracy: The 2018 Democratic Audit, Patrick Dunleavy explores why.
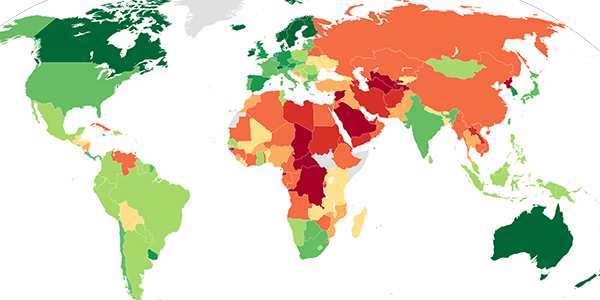
Map visualising the Economist Intelligence Unit’s 2017 Democracy Index. Picture: By BlankMap-World6.svg: Canuckguy and others. Derivative work: DEGA8 with information from Democracy Index 2017. Map via a (CC BY-SA 4.0) licence)/Wikimedia Commons
A number of influential comparative rankings offer ‘league tables’ of democracy, based heavily on quantitative indicators, and sometimes also expert assessments, collated in a systematic way, and looking across many varied aspects of democratic political life. Figure 1 shows some of the main indices and how they currently rate the UK, plus any overall classifications they give, together with a brief note on the methods used to compile them. The indices covered here are up-to-date or relatively recent. They are orientated to measuring relatively fine-grain changes, and have reasonably sophisticated methodologies.
Figure 1: Some current overall quantitative rankings of liberal democracies and how they rate the UK in 2017–18
| Name of index | Produced by | Rating of the UK | UK rank | Lowest scoring elements | Methods (linked to UK data page) |
|---|---|---|---|---|---|
| Democracy Index | Economist Intelligence Unit (EIU) | 8.5 out of 10. Classed as ‘Full democracy’ | 14 | ‘Functioning of government’ = 7.5 out of 10 | Varied, not entirely clear |
| Varieties of Democracy | V-Dem at University of Gothenburg | 87% on the Liberal Democracy Index | 16 | 68% on the ‘Participatory component’ | Quantitative data analysis, aggregated into six components |
| Global State of Democracy | International IDEA | 83% average score across 16 political/institutional dimensions | not given | 17% on ‘direct democracy’; 60% on electoral participation | Varied, but data-heavy |
| Democracy Barometer | University of Zurich (in 2014) | 58% on overall ‘democratic quality’ index, across 9 political/institutional dimensions | 2014 rank not given, but was 26 in 2011 | 49% on representation dimension; 53% on popular control and social equality | Quantitative data analysis, aggregated into six components |
| Democracy Ranking | Austrian NGO, Democracy Ranking (in 2014) | 75% across seven political, economic and other dimensions | 14 | 62% on the economy; 64% on knowledge of democracy | Varied indices, but uses data |
The Figure is arranged in a rough descending order of each of the index’s influence, with the Economist Intelligence Unit’s ‘Democracy Index’ much the most widely quoted, although its methods are not entirely clear. The next three are academic productions, with better explained methods. The IDEA index has been adopted by the UN. The Zurich ‘Democracy Barometer’ accords a lot of influence to the proportionality of the electoral system, which other measures more or less ignore. The ‘Democracy Ranking’ has not been updated and is relatively obscure compared to the others.
What picture do these scorings give about UK democracy? Essentially, despite its long evolutionary history and claims to iconic status (for example, as the home to the ‘mother of parliaments’), the UK remains ‘first division’ but not ‘premier league’. All the rankings agree that the UK is one of the world’s broad top group of democracies, but none of them put it within the top ten positions. However, the top-scoring countries tend to be small or very small countries, especially the Scandinavian countries with some tiny additions (like Estonia). Arguably it is much easier to run a liberal democracy with (say) six million people than with the UK’s current 66 million. And, of course, it is harder still to run a democracy with 300 million people (as in the USA), and very hard to do so with 1.2 billion people (as in India). Smaller states are more straightforward to operate, and organising public participation and consultation there is simpler. So perhaps this explains the UK’s absence from the top ten. Five of the six rankings also score participation-related aspects as the UK’s weakest area. However, the EIU index instead scores Britain lowest on how well government operates.
(Side note for geeks: In addition to the indices above, there are literally hundreds of different classification schemes that are of no use to us here, because they are primarily orientated towards the comparative classification of countries over time [for example, across the last century]. Alternatively they may use simplistic typologies [where the UK is just always in the top/best ‘democracy’ category], or are now very out of date. They have been discussed a lot by political scientists and development economists, but they are useless for our purposes here because the UK just gets a ‘ceiling’ score in them. A well-known example is the Polity IV score, which does update every year but always gives the UK a ‘perfect’ 10 out of 10 score [along with the USA] – whereas other democratic countries [like France] are often scored 9 out of 10. It is produced by a US think tank, and funded by the CIA.)
In addition to the overall democracy rankings, there are a large number of other measures of particular aspects of institutional processes that are highly relevant to democratic performance. Figure 2 shows how the UK compares with other countries on some key institutional criteria: freedom of speech and media, civil service effectiveness and corruption. Their importance for democratic performance is clear-cut – with corruption and media manipulation by political leaders especially emerging as central means of contemporary democratic decline.
Figure 2: Some current rankings of partial institutional aspects of liberal democracy, and how they rate the UK in 2017–18
| Name of index | Aspect of democracy covered | Rating of the UK | UK rank | Methods |
|---|---|---|---|---|
| Freedom House Index | Freedom, political rights, civil rights | 94% out of 100%. Also: Score = 1 (‘fully free’) on a seven-point scale | 16 | 2018 rating Both Press and Net freedom status = free |
| Transparency International | Corruption, bribery etc. | 81% out of 100 | 10 | Survey evidence of perceptions of corruption |
| INCISE Index of Civil Service Effectiveness | How well national bureaucracies operate, using objective indicators and expert judgements. Produced by UK think tank, the Institute for Government (with UK civil service funding). | Implied average score of 0.87 across three macro-indices | 4 out of 31 countries assessed | 76 metrics aggregated into 12 component scores (see p.63). UK ranked top for 3, but below 50% for capabilities and digital services. |
On both freedom measures and the absence of corruption the UK does well, but does not score exceptionally high. The INCISE measure of civil service effectiveness gives the UK its highest ranking of any comparative measure, at fourth out of 71 countries covered. However, INCISE could be seen as generous to the UK – for example, in giving the UK top marks in regulatory effectiveness for 2017, despite the crisis of building regulations revealed by Grenfell Tower, and the earlier neglect of macro-prudential regulation of bank liabilities.
Another relevant set of partial criteria to consider for liberal democracies are shown in Figure 3, which covers social or output-related measures. These focus on how countries perform in meeting people’s basic needs, achieving well-being or happiness for citizens, and achieving decent levels of social equality (or inequality). Their relevance for democratic performance lies in the salience of including all citizens in political life on relatively equal terms, which clearly requires that some measure of social equality is maintained. Again, the UK is placed in a rather familiar ‘good but not outstanding’ category, except on social inequality where it is placed in the bottom group of OECD countries, alongside the USA.
Figure 3: Some current rankings of output/political equality aspects of liberal democracy, and how they rate the UK in 2017–18
| Name of index | Aspect of political equality covered | Rating of the UK | UK rank | Methods |
|---|---|---|---|---|
| Social Progress Index | Index of how far society meets people’s basic needs, creates well-being foundations and offers opportunities | 89% out of 100 | 12 | Index aggregated from 12 underlying indicators, then normalised |
| World Happiness Report | Happiness index based on healthy life expectation, social support, generosity, choices | 6.7 out of 10 (top country’s score = 7.6) | 19 | Mix of survey data and country statistics |
| OECD late 2000s | Inequality after taxes and transfers (GINI coefficient) | 0.345 (Best country = 0.25. Worst country = 0.48) | 27 (out of then 34 OECD countries) | Country statistics on income levels across social groups |
Summing up, quantitative assessments and league tables of democratic performance tend to have a problem with ‘ceiling’ effects, with ‘advanced’ countries bunching near the top. Even allowing for this, the UK rarely makes the ‘premier league’ of excellent performers, coming in instead in the ‘first division’ of good but at times somewhat flawed democracies.
For any one ranking it is always possible to make an argument that the measures being considered are problematic in some degree, or have been put together into component indices in ways that reflect value judgements – which indeed are inevitable in this field of work. However, the UK’s recurring placement across multiple rankings is not so easily dismissed – for the inaccuracies or potentially questionable features of indices tend to wash out when we look at many different measures.
Democratic Audit’s disaggregated approach
The limited single-country insights to be gained from quantitative rankings or ‘league tables’ of democracy is one key reason why the 2018 Democratic Audit follows a different path. Aggregated quantitative indices are also rather ill-adapted to assess the democratic quality of advanced countries, especially where they take the established democracies as an unproblematic standard for the assessment of developing countries, which is potentially a rather smug assumption.
Instead our new book, The UK’s Changing Democracy, gives a detailed, section-by-section evaluation of the UK’s performance, with no simplifying, summative assessment at the end – although we do try to systematise somewhat on the lines of ‘qualitative comparative analysis’. As a pioneer in the field auditing democracy, David Beetham, argued:
‘aggregation into a single score is inappropriate to the distinctive purpose of a democratic audit, which is to help differentiate between those aspects of a country’s political life which are more satisfactory from a democratic point of view and those which give cause for concern. For this purpose, keeping the different aspects separate, and making a discursive assessment of each in turn, is both a more appropriate and a more defensible procedure’. (Beetham, 1999, p.569).
And indeed, we find that the salient recent changes in UK democracy are subtle ones. Their effects cumulate and interact in ways that any aggregate index would find difficult to capture.
This article is adapted from the introduction to The UK’s Changing Democracy: The 2018 Democratic Audit, published by LSE Press, on 1 November 2018.
Patrick Dunleavy is Professor of Political Science and Public Policy at the London School of Economics, and Centenary Professor at the University of Canberra. He is the lead editor of The UK’S Changing Democracy: The 2018 Democratic Audit (LSE Press, 2018), published free and open access on 1 November.
Similar Posts
Subscribe
If you enjoyed this article, subscribe to receive more just like it.


 Democratic Audit's core funding is provided by the Joseph Rowntree Charitable Trust. Additional funding is provided by the London School of Economics.