General election 2019: what difference are the Unite to Remain and Brexit Party pacts likely to make?
The Unite to Remain alliance means the Lib Dems, Plaid Cymru and the Greens are trying to pool their votes to ensure a Remain-backing candidate is elected. But the Brexit Party’s decision to stand down their candidates in Tory-held seats makes this tougher. Heinz Brandenburg concludes that the overall effect of these pacts will be minimal.
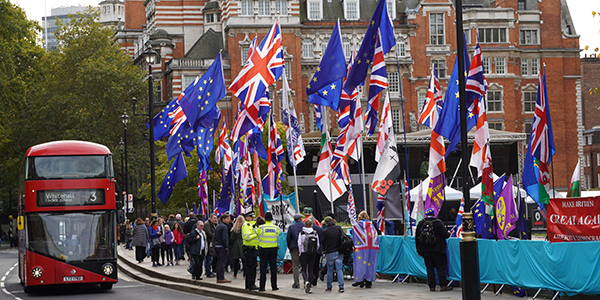
Pro- and anti-Brexit protestors in Westminster. Photo by Franz Wender on Unsplash
Now we have both a Remain and a Leave alliance – sort of. The Remain alliance is limited in that it only covers 60 constituencies while the Leave alliance is both one-sided and limited, in that the Brexit Party is unilaterally standing down its candidates but only in constituencies that the Conservatives won in 2017. How these moves to not field candidates will affect the overall outcome is quite unpredictable – especially since we don’t yet know how the polls will respond to the withdrawal of the Brexit Party from half of the electoral contest. But we do have some data from different sources to make an initial assessment, which is essentially that the imminent effect of either move seems quite modest and that both partly cancel each other out.
The ‘Unite to Remain’ pact that covers 60 seats across Wales and England was earlier assessed by the Financial Times, which estimated that, based on uniform regional swings against 2017 results calculated from current opinion polls, only a couple of seats may actually change hands, but others could be turned into marginals. Similarly, there are reasonable doubts over the benefit for the Tories from Nigel Farage’s decision: as Rob Ford put it, the ‘Brexit Party standing down where Cons won in 2017 certainly helps Cons defend seats. But Cons didn’t get a majority last time, and they need a majority next time. They need to gain seats.’
I am using different data sources in order to take into account both where the pacts are in operation and how the voters of the involved parties can be expected to respond to being denied their first choice. It would be overly simplistic (and surely wrong) to assume that wherever the Brexit Party does not stand all of their voters will collectively move over to the Conservatives. Similarly, not every Liberal Democrat, Green or Plaid Cymru voter is likely to vote for one of the others where their own party is not fielding a candidate.
We can use individual-level data from the British Election Study Internet Panel to get an idea of how voters of each party are likely to react to being denied their preferred choice. The BES Panel does not only ask about vote intention but also repeatedly includes a so-called propensity to vote (PTV) question asking ‘How likely is it that you would ever vote for each of the following parties?’, with an answer scale from 0 (very unlikely) to 10 (very likely). Using the most recent wave (Wave 16) from May/June this year, we can estimate how Brexit Party, Liberal Democrat, Green and Plaid Cymru supporters might distribute their votes in the absence of their own party. We need to choose a cut-off point on the 0–10 scale that defines another party as a possible electoral alternative. I decided to go for the mid-point (5). That means that, for example, for Brexit Party voters, I assume everyone who scores the Conservatives 5 or higher on the PTV question could reasonably lend them their vote.
Now, importantly, the Conservatives are not the only possible beneficiary. The table below summarises the vote transfer patterns for each party, but ignoring minor transfers (like Brexit Party to Lib Dems or Greens to Tories). Yes, the Conservatives are the main beneficiary from the Brexit Party standing down in a constituency, but on this reading they may only get just under half the votes, with another 8% going to Labour. And in each case, while the voters of a Remain party not standing are more likely to lend their votes to another member of the Unite to Remain pact, the Labour Party is also set to capture considerable votes. In no case can we expect more than half of the votes going to the intended recipient. Plaid Cymru voters look like they will be least pleased, especially when their party makes space for a Liberal Democrat.
Some of this has to do with the fact that over 10% and over 15%, respectively, of current Plaid Cymru or Green supporters are actually in favour of Brexit and against a second referendum. Also, the supporters of both parties see the Liberal Democrats as much more centrist then they see themselves. Many of them are equidistant to both Liberal Democrats and Labour on the standard left-right scale. And if the campaign continues to evolve as it has so far, we may come to expect vote transfers to split even more in favour of Labour than they look here.
Using this information about likely vote transfer patterns, we can assess in more detail the likely impact across constituencies that are affected by the respective ‘alliances’. To do so, I am using the constituency estimates that Chris Hanretty recalculated based on the Multilevel Regression and Post-Stratification (MRP) model used by Best for Britain to derive tactical voting advice.
The first set of plots below show how the Conservatives are doing across all English and Welsh constituencies against Labour (horizontal axis) and the largest Remain party (vertical axis), distinguishing between constituencies they are defending from 2017 (larger blue dots) and those where they are challengers (smaller black dots). The first panel uses the MRP estimates to show their performance before any transfers from the Brexit Party are taken into account. We can see that they are leading both Labour and the largest Remain party in almost all constituencies they are defending from 2017 (indicated by their position in the top right quadrant). There are only six exceptions. All of them are in the bottom right quadrant, which means they are ahead of Labour but behind the Liberal Democrats. When we include transfers from the Brexit Party (second panel) we see three of those constituencies changing hands, with the Tories moving into the lead (Lewes, St Ives, Winchester). Then, when we includes transfers from Remain parties to other Remain parties and Labour, the Tories do manage to hold on to those three constituencies but lose one constituency they are challenging in (Ynys Môn, a three-way marginal that Plaid would gain from Labour who won it in 2017).
Now looking at the impact of the Unite to Remain alliance on their performance, we are plotting the chosen Remain party against Conservatives (horizontal axis) and against Labour (vertical axis). The first panel of the next plot shows how before any transfers, Remain parties are winning in 23 constituencies, 12 of which are included in the Unite to Remain pact (large light blue dots):
• Greens: Brighton, Pavilion
• Liberal Democrats: Bath, Cheltenham, North Norfolk, Oxford West and Abingdon, Richmond Park, Twickenham, Westmorland and Lonsdale, Winchester
• Plaid Cymru: Arfon, Dwyfor Meirionnydd and Carmarthen East and Dinefwr
Once we include transfers from the pact (second panel), we see Remain parties gaining an additional four constituencies:
• Liberal Democrats: Cheadle, Hitchin and Harpenden, Southport
• Plaid Cymru: Ynys Môn
But when we include transfers from the unilateral withdrawal of the Brexit Party across Tory-held seats, all but one of these seats (Ynys Môn) change back into Tory hands, while Remain parties also lose another two seats where no pact is in place.

On this count, the overall effect of both ‘pacts’ is very limited indeed, with the Conservatives only gaining three seats and the Remain parties losing two.
What matters perhaps much more is how the Brexit Party standing down turns plenty of Tory seats considerably safer than they’d be with them standing. The Unite to Remain pact does very little to change this. In contrast, the Unite to Remain pact may make a few constituencies which are already pretty safe just a little safer still. On its own, it would bring a considerable number of seats into play and render them marginal, but the Brexit Party standing down is removing much of that potential advantage.
Overall, the main impact of the Brexit Party withdrawal could be its interference with the Unite to Remain alliance. The problem for the Remain parties is that almost two-thirds (precisely 37) of its 60 chosen constituencies are held by the Tories since 2017. That ultimately explains why in our projection here all four of their potential seat gains are scuppered once we take Brexit Party transfers into account.
This post represents the views of the author and not those of Democratic Audit. It was first published on the LSE Brexit blog.
About the author

Heinz Brandenburg is a Senior Lecturer in Politics at the University of Strathclyde.
Similar Posts
Subscribe
If you enjoyed this article, subscribe to receive more just like it.


 Democratic Audit's core funding is provided by the Joseph Rowntree Charitable Trust. Additional funding is provided by the London School of Economics.