All of Wales’ main parties have many supporters with views that the party leaderships would find uncomfortable
The rise of anti-immigration parties across Europe has led many to question whether their success has its roots in the prejudice of voters. In Wales, Roger Scully has carried out some research which shows which party supporters are prejudiced against which groups to what extent. Here, he shares his findings.

A talk in Cardiff, Wales (Credit: Reway2007, CC BY NC SA 2.0)
The other day I was looking back through some old survey data. It was the 2011 Welsh Election Study (WES) that I was looking at, and I was reminded of some questions that we ran in that study. These were a series of questions regarding various groups in society, including some obvious and high-profile minority groups. Some four-and-a-bit years on I can’t recall the exact motivation behind these questions, or who suggested them; but they were presumably an attempt to explore various forms of prejudice within Welsh society.
The question form was as follows:
“Now using a scale from 0 to 10, where 0 means feel very unfavourable and 10 means very favourable, how do you feel about…”
with this question then applied to each of the following groups:
Gay and lesbian people
- Muslim people
- Black people
- Asian people
- White people
- People who speak Welsh
- People from England who come to live in Wales
- People from Eastern Europe who come to live in Wales
It is worth mentioning at this stage, I think, that these are questions which work particularly well on an internet survey (as WES was). There is significant evidence, particularly from studies conducted in the United States, that people are more willing to admit to prejudicial or socially undesirable attitudes in the relative anonymity of an internet-based survey than when they are interacting directly with another human being (as happens in telephone or face-to-face surveys).
It may also be worth mentioning that, as far as I am aware, no-one has done anything in terms of publishing or analysis with the results from these questions. The data are all freely available here, so perhaps I can prompt someone into exploring it further?
In the remainder of this post I’ll just give an outline of what we found. First, in the following table, I’ll try to summarise the overall WES findings by giving four statistics for each group for which we asked this question. These four statistics will be:
- The percentage of WES respondents giving 0 out of 10 for that group (in short, those expressing the maximum degree of unfavourability to members of that group)
- The percentage of WES respondents giving between 0 and 4 for that group (so, those rating that group somewhere on the unfavourable side of the 0-10 scale)
- The percentage of WES respondents giving 10 out of 10 for that group (in short, those expressing the maximum degree of favourability to members of that group)
- The percentage of WES respondents giving between 6 and 10 for that group (so, those rating that group somewhere on the favourable side of the 0-10 scale)
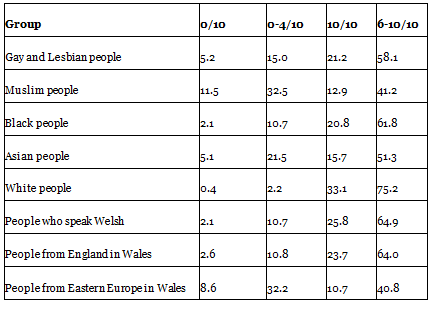
So what can we make of this overall patterns of responses? I guess if you are a ‘glass half-full’ person then you would be encouraged to see that there were more people expressing favourable than unfavourable attitudes towards every single group mentioned here. On the other hand, there are significant levels of un-favourability shown here towards a number of different groups in society. More than one in seven respondents had unfavourable attitudes towards gay and lesbian people; and nearly one in three had similarly negative views regarding Muslims and people from Eastern Europe. This evidence does not suggest that Wales is quite as tolerant a place as some of us might sometimes like to think it is.
While I was playing around with this data, I thought it would also be interesting to look at the breakdowns by supporters of the different parties. I was particularly interested in level of hostility towards the different groups among supporters of any of the parties. So below is another table of figures, where I have looked at attitudes amongst those who identify with each of the four main parties (or, rather, what were the four main parties in Wales back in 2011. The past is a foreign country – they did politics differently then).
For each party, in relation to each group, there are two figures. The first number is the percentage of identifiers with that party who rated that particular social group at 0 out of 10 on the favourability scale. The second, larger number will be the percentage of identifiers with that party who rated that group at somewhere between 0 and 4 out of 10 on the scale.
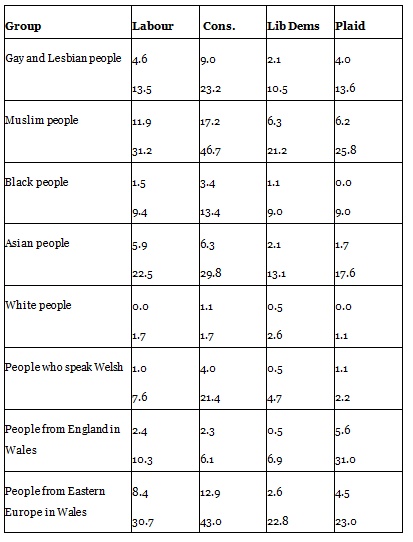
There are a few oddities in the results, such as the tiny number of Plaid Cymru supporters who are apparently deeply hostile to Welsh speakers. (Or, perhaps more likely, got the scale the wrong way around). Overall, it would appear that Liberal Democrat identifiers are, on average, the most tolerant. (‘Supporters of Liberal Party in Liberalism Sensation’). But I think that the key message from this data should be that all the parties have a significant number of supporters who have some views that the party leaderships would probably be rather uncomfortable with. And much of this data from 2011 perhaps helps us to understand why UKIP’s message on immigration has found a receptive audience in parts of the Welsh electorate in subsequent years.
—
This post represents the views of the author and not those of Democratic Audit or the LSE. It originally appeared on The Cardiff University Elections in Wales site and is reposted with permission. Please read our comments policy before posting.
—
 Roger Scully is Professor of Political Science in the Wales Governance Centre at Cardiff University. He is the co-author of Wales Says Yes: Devolution and the 2011 Welsh Referendum (University of Wales Press, 2012), and was Director of the ESRC-funded 2011 Welsh Referendum Study and 2011 Welsh Election Study. He blogs at Elections in Wales and tweets @roger_scully.
Similar Posts
Subscribe
If you enjoyed this article, subscribe to receive more just like it.


 Democratic Audit's core funding is provided by the Joseph Rowntree Charitable Trust. Additional funding is provided by the London School of Economics.
All of Wales’ main parties have many supporters with views that the party leaderships would find uncomfortable: https://t.co/9Hfq9DKlrv
All of Wales’ main parties have many supporters with views that the party leaderships would find uncomfortable https://t.co/9FyvcoOfgz
All of Wales’ main parties have many supporters with views that the party leaderships would find uncomfortable… https://t.co/rhacm4Lvpx
All of Wales’ main parties have many supporters with views that the party leaderships would find uncomfortable https://t.co/3pcCHzEreZ #Op…
All of Wales’ main parties have many supporters with views that the party leaderships would… https://t.co/VVnCqJVqvF https://t.co/QMRQWx9f2H