The new House of Commons is on the whole no more experienced than the last
A new House of Commons was elected at the General Election, where an almost unprecedented number of frontbench MPs – including Ed Balls, Esther McVey, and Jim Murphy, all lost their seats. But how experienced is the new House of Commons? Oliver Hawkins argues that, depending on how you measure it, this set of MPs is no more experienced than the last.

Credit: Alex Ingnatzy, CC BY NC SA 2.0
How much experience of Parliamentary service does the newly elected House of Commons have? The answer is that it depends on how you measure it. The following chart shows the mean and the median number of years served in the Commons by MPs elected at each general election since 1983.
The mean is what people typically think of when they talk about averages — it’s the total number of years that MPs in each group have worked in the Commons divided by the number of MPs in the group; while the median is the value which divides the group in half — in each group of MPs, half have fewer years of Parliamentary service than the median and half have more.
As the chart shows, the typical number of years service among MPs elected at each general election differs depending on whether you measure it using the mean or the median. What’s more, the trends differ between the two measures.
Using the mean, the MPs elected in 1997 were the least experienced of any Parliament since 1983. But using the median, the group of MPs elected in 2001 were the least experienced.
So which is the more appropriate measure? Arguably, you need to consider both measures, because the difference between the two reflects the shape of the distribution of experience among the MPs in each group.
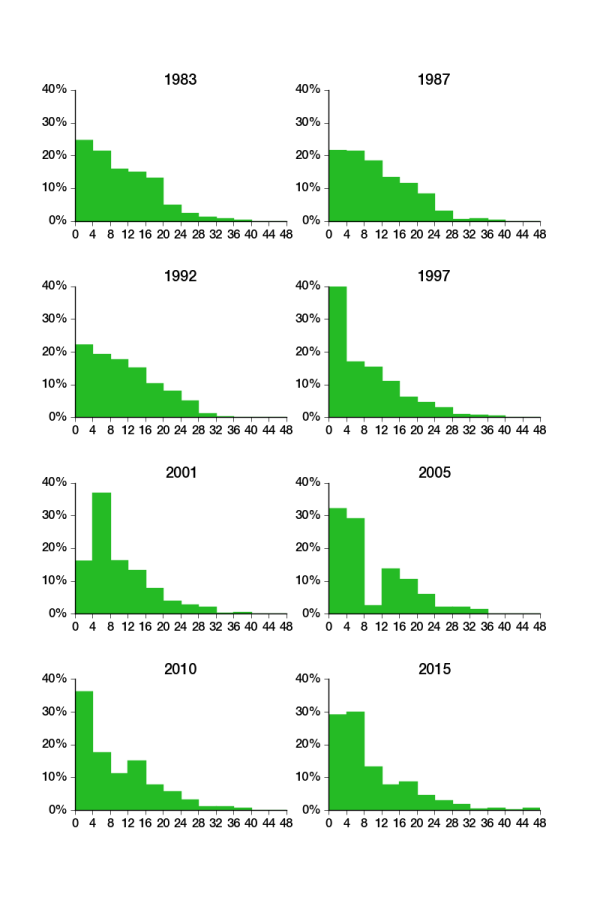
The following histograms show the distribution of Parliamentary experience among each cohort of MPs elected at general elections from 1983 to 2015. In each histogram the bars show the percentage of MPs whose total length of service in the House of Commons falls between the numbers shown on the X axis at the bottom of the chart. So around 29% of MPs elected at the 2015 General Election have fewer than four years experience in the Commons — these are the MPs elected for the first time at the 2015 General Election plus some of those elected at by-elections during the last Parliament.
The difference between the mean and the median in a group is determined by the overall shape of the distribution. In more normal distributions — the more convex and bell-shaped groups — the mean and the median are closer together; while in more skewed distributions — the more concave and L-shaped groups — the mean and the median are further apart.
Generally speaking, the mean is the better measure for normally distributed data, while the median is a better way to summarise data that is skewed. Here the skewness of the distribution varies among groups of MPs, so if you had to choose just one measure of Parliamentary experience, the median is the more robust statistic.
The distribution of experience among MPs elected in 2010 and in 2015 is similar, but not identical. Both distributions are skewed. But both the mean and the median years of service are almost exactly the same in both groups. And although it is possible to identify the group of MPs newly elected in 2010 as a more experienced group in 2015 (among those with four to eight years experience) a similar sized group of newly elected MPs also joined the House in 2015, while at the same time the proportion of MPs with more than 12 years service fell.
So while many ministers now have several years experience in government, the new House of Commons is on the whole no more experienced than the last. But the precise mix of experience among elected MPs is particular to each Parliament.
—
This piece was originally published on the House of Commons Library blog ‘Second Reading’, under the title ‘How experienced is the new House of Commons?’ Please read our comments policy before posting.
—
 Oliver Hawkins is a Statistical researcher at the House of Commons Library


 Democratic Audit's core funding is provided by the Joseph Rowntree Charitable Trust. Additional funding is provided by the London School of Economics.
The new House of Commons is on the whole no more experienced than the last https://t.co/oo6sJ1lhTF
The public policy folks @democraticaudit have re-published my article exploring how experienced the new HoC is … https://t.co/3fLZnFwNj3
The new House of Commons is on the whole no more experienced than the last https://t.co/MMBXAXFtpt #Option2Spoil
The new House of Commons is on the whole no more experienced than the last https://t.co/lqCvpbSzlr