Euro elections – we predict the results for every region in the UK
To sustain voting in liberal democracies, it is vital to give voters immediate feedback on what their votes mean. The Democratic Audit team has been analysing the competition in the UK’s European Parliament elections at regional and country level. To round off our coverage we now predict these results in a detailed way, based on the most recent opinion polls and a careful simulation of the List PR system in every region.

Credit: Anna Freun, CC BY ND
In a democracy, voters should have their votes counted as soon as polling closes, so that they get speedy feedback on what has happened as a result of their choices. Yet the European election results will not be announced until after 10pm on Sunday, a gap of three days. Nor do we have any exit polls – none have been conducted because it is not legal to publish their results. Supposedly this is in order to not affect later voting going on in the other EU countries. Yet this reasoning is quite bizarre. Each European country has its own distinctive party system. And voters in any one country are very little aware of what happens in other countries, and they assign it very little importance in influencing how they themselves vote. So the delay makes no sense and can only harm UK democracy and future turnout levels.
To combat the intended vacuum of information, we used the four last opinion polls on how people intended to vote in the European elections, conducted just this week by three different polling companies. From these we took an average (median) outcome for each party, and applied a small correction for the greater votes dispersal across smaller parties in actual EP votes compared to opinion polls. We assume therefore that UKIP gets a 28.5 per cent vote share, Labour 25.5, Conservatives 21.5, Liberal Democrats 9 and Greens 7. In Scotland we assume the SNP comes out top, and in Wales that Plaid Cymru finishes fourth, both in line with the latest regional opinion polls.
Next we simulated a regional contest for each of the regions of England and for Scotland and Wales, using the particular form of List PR that is employed in these elections. This allowed us to map in great detail the sequence in which parties won every seat being contested, and to pay special attention to who gets to win the last one or two seats in each region.
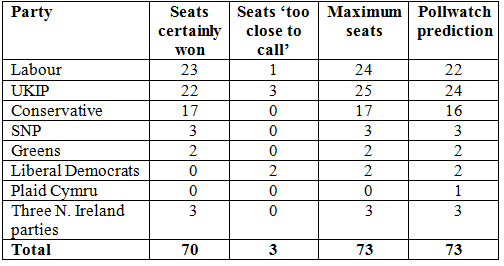
Table 1 here shows our UK-wide results. We expect both UKIP and Labour to make big advances in terms of winning seats. The Conservatives will suffer losses but still hold many MEPs, but almost all Liberal Democrat MEPs will disappear. We project the Greens to hold their two seats, and the SNP to do well in Scotland. The BNP (British National Party) will lose both its current MEPs.
Table 1: How the parties have won MEPs
Note: To access the Pollwatch EU prediction go to their home page and then click on the UK part of the EU map.
We also compare our prediction with the separate Pollwatch UK projection. The two are close, but Pollwatch assigns some seats to UKIP that we feel are ‘too close to call’, and expects the Conservatives to gain one seat less than we do. One of the two close to call seats in Yorkshire and Humberside is a UKIP versus Labour knife edge, while two (in the South East and South West) are UKIP versus Liberal Democrat contests.
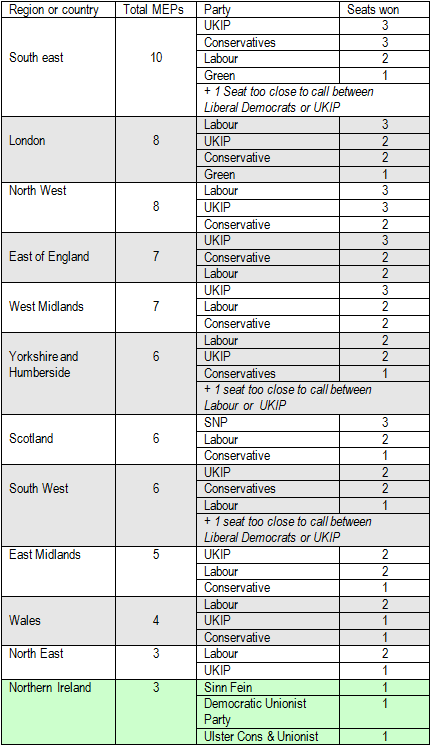
To get more detail of the picture, Table 2 shows the leading parties (listed in the order vote shares we expect) and the seats that they should win, across every region of the UK. It also identifies the regions with knife edge last seats.
Table 2: Predicted outcomes at regional level of the 2014 European Parliament elections
Any projection like this comes with a health warning. A key limitation of the analysis throughout is that we have had to assume uniform national swing effects – i.e. that the same changes in party support acting across the country, which we know is not accurate. However, we did check the sensitivity of variations in support across the parties – see the further details below.
The one imponderable might be that if UKIP does sharply worse than the national trend in London, (of which there are some signs from the London Borough Elections) a three-way knife edge contest could open up between Labour, UKIP, and the Liberal Democrats for who gets the last seat.
Annex: More details on how we got our results
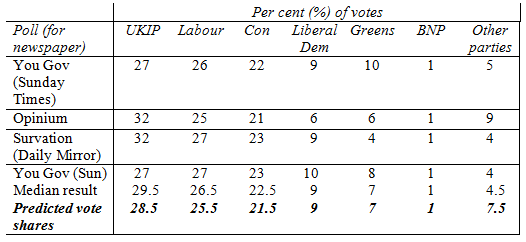
We looked at the last four polls on how people intended to vote in the European Parliament elections, and took the median result for each party. To get our predicted vote share (shown in the bottom line) we added a correcting effect of -1 per cent each to the vote share of the top three parties (UKIP, Labour and the Conservatives) – this controls for the impact of the very large and long European Parliament ballot papers. The actual ballot papers that voters are given include multiple smaller parties that opinion pollsters do not prompt their respondents about. Yet we know from past European elections using the List PR system that a considerable amount of votes are dispersed across these unfamiliar options.
For Scotland and Wales we looked at the scantier recent polling evidence also on the relative performance of the Scottish National Party and Plaid Cymru respectively, and made changes for their larger party systems. Otherwise we assumed a uniform national swing between the top parties across the country.
Table 3: Predicting European Parliament election vote shares
Next we ran simulations of the precise List PR system used to allocate seats in each region, which is called the d’Hondt system after its Belgian inventor. Essentially this works by allocating the first seat in a region to the largest party, and then immediately dividing its vote share by its N of seats + 1, in this case making 2. We next allocate the second seat to the party with the largest vote share remaining, and make the same division for it. We keep doing this with parties that have no seats, until one of the parties already with one seat now has the largest unrepresented vote share. That party therefore gets a second seat, and we now divide its vote share by N of seats +1 = 3, and so on. We follow this procedure through as parties win more seats until at the end of the process the last remaining seat is allocated to the party with the largest still under-represented vote share.
The European contest is much easier to predict than other forms of competition, because small changes in vote share often do not make much difference to the seats outcomes. The sensitivity of the results depends on two things:
- the size of the regional constituencies: smaller regions are normally easier to predict; and
- the fragmentation of votes between the parties, which sometimes suggests clear-cut outcomes, and at other times may be closer, or even too close to call).
In tricky cases we also examined whether small fluctuations in party support would make much of a difference to seat outcomes. And we bore in mind both regionally specific effects shown by opinion polls (such as Labour’s greater strength and UKIP’s relative weakness in London) and the emerging patterns of party support shown in early 2014 local election outcomes.
—
Click here to see our briefings for the UK’s Euroepean Parliament constituencies
Please read our comments policy before posting. A shortened URL for this post is: https://buff.ly/1k1oOxJ
Similar Posts
Subscribe
If you enjoyed this article, subscribe to receive more just like it.


 Democratic Audit's core funding is provided by the Joseph Rowntree Charitable Trust. Additional funding is provided by the London School of Economics.
interesting
Check out DA’s prediction of the European Parliament elections in the UK here https://t.co/CXwZBQZNiU
Predicting the results of the EU elections https://t.co/Wdi6mBxPQQ – a great source of information via @democraticaudit
Tomorrow, we’ll find out the results of the European Parliament elections. The DA team has predicted the UK result https://t.co/gBhImiuOYT
Euro elections – we predict the results for every region in the UK https://t.co/uGwsQUczbb
EU election predictions from Democratic Audit. Only a few hours till the real thing.
https://t.co/hqYS7D8cQj
Why exclude the latest TNS and ComRes polls? You have to draw line somewhere, but excluding two major polling companies, particularly those that have been showing a higher UKIP figure, doesn’t seem very objective or scientific, and undermines the credibility of your forecast.
Mark Watts
Director
Luther Pendragon Brussels
Thanks for the comment Mark. Our approach was 100% objective. We used polls from the final two days of the campaign only. If we had used the final three or four days, the projection would have been based on older data. Furthermore it would have meant including another YouGov/Sun poll too which had a very low UKIP figure of 24%. In any case, we did not choose the methodology based on what the party figures in each poll were, or any decision to include/exclude particular pollsters. And once you’ve decided on a methodology you shouldn’t change it because you want to pick and choose the data. You may think that makes our forecast appear less credible, but it’s actually more credible because of it.
Euro elections – We predict the European Parliament election results for every region in the UK https://t.co/riv5LX37JE
@democraticaudit predicts the Euro elections results for every region in the UK and what seats are too close to call https://t.co/SLzkvnxo2E
RT @cjnu1: The @democraticaudit team predict two seats for the #LibDems in the Euro elections poll. #Vote2014 https://t.co/bQ0QBwr9zy
RT @MissMillicent: Euro elections – @democraticaudit predict the results for every region in the UK https://t.co/PS98aGXHxC < interesting pr…
Democratic Audit suggests 23-24 Labour MEPs could be elected if opinion polls are correct https://t.co/SVYXcg3Dmy (via @PJDunleavy) #EP2014
@vriyait predictions https://t.co/7tm1ubaLOx
RT @kealanjflynn: Predicted distribution of 73 UK seats in EP: UKIP 24; LAB 22; CON 16; OTHERS 11. https://t.co/JxedUKiCWr | via @PJDunleavy…
RT @PJDunleavy: UK voters shouldn’t have to wait 3 days to know who’s won our Europe vote. Democratic Audit has the best forecast https://t.…
Euro elections – the DA team predicts the results for every region in the UK https://t.co/CMMlgKIa9k
Euro elections – We predict the European Parliament election results for every region in the UK https://t.co/SKpbpj6a0e