Free and fair? 2016’s elections so far, ranked by integrity
Which countries hold the fairest elections? The Perceptions of Electoral Integrity dataset analysed every election held so far in 2016 and ranked countries in order of electoral integrity. Ferran Martinez i Coma introduces the findings and identifies some important trends – notably a move away from ballot-stuffing and towards abuses of campaign finance and media manipulation. For the first time, the questionnaire introduced questions about bribery, patronage and the fear of political violence.
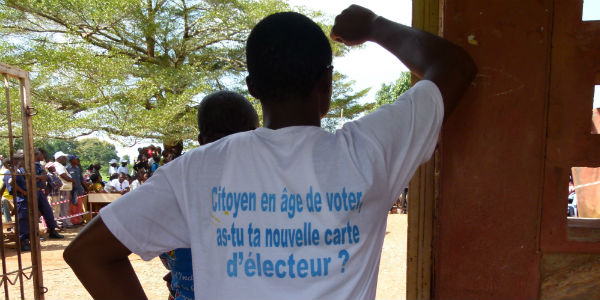
Gbadolite, Province du Nord Oubangui in the Democratic Republic of Congo, July 2016. The T-shirt reads ‘Citizen of voting age? Have you got your new voting card?’ The UN encouraged the Independent National Electoral Commission in DRC to implement a transparent and credible revision of the voters’ register. Photo: MONUSCO via a CC-BY-SA 2.o licence
The Electoral Integrity Project (EIP) has released its last version of the Perceptions of Electoral Integrity (PEI) dataset. This version (4.5) includes responses on the integrity of the elections of 2417 experts [1] for 213 elections in 153 countries. The coverage of the data is truly global as it covers 33 elections in 32 countries.
Among others, this release includes the anticipated Peruvian legislative and presidential elections as well as the presidential elections in Niger, Benin, Chad, Djibouti and Cape Verde. It also includes the legislative contests in Cyprus, Vanuatu, Laos and Ireland. The data, which adds to previous releases, can be downloaded free of charge here in different formats and is available at the expert, election and country level.
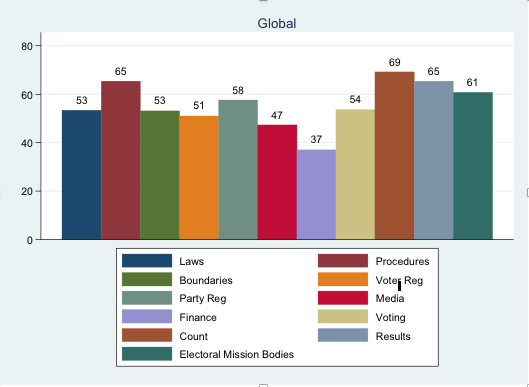
The questionnaire is very rich as it includes 49 items monitoring the quality of election procedures, and over a dozen political, socio-economic, and demographic background factors. The questionnaire items are organised over the electoral cycle covering its eleven dimensions – laws, procedures, boundaries, voter registration, party registration, media, finance, voting, count, results and electoral management bodies. There are endless possibilities for analysis. In this brief post, I mainly focus on some descriptive statistics without searching for any causal relation. Concretely, I describe the electoral integrity index, the global performance of the dimensions and introduce a new rotating module on clientelism and coercion.
In order to assess the overall integrity of the election, we asked experts to evaluate the elections according to 49 items, which were grouped into eleven categories reflecting the whole electoral cycle. All the responses have been aggregated into a summary 100-point PEI Index. The results for the 33 elections gathered in the first half of 2016 are presented in the graph below:
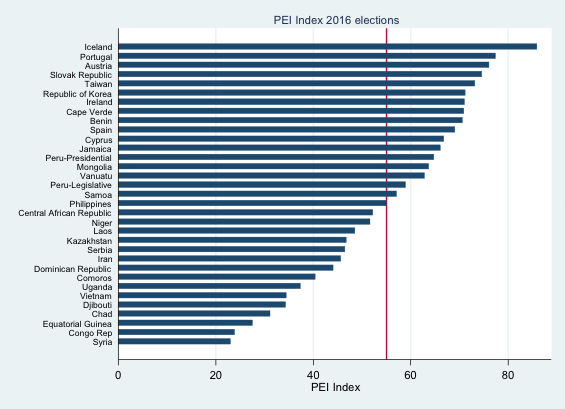
According to the experts, the best elections were held in Iceland, Portugal and Austria while the worst were in Syria, the Republic of the Congo and Equatorial Guinea. The red line marks the global average. There are several African countries such as Benin or Cape Verde performing significantly above the global average and at the same level as some European countries.
Contrary to conventional wisdom, the graph shows the best performing dimension is related to vote counting. It suggests the era in which ballot boxes were tampered with and stuffed with extra votes is over. This is not to say that there are not other problems of electoral integrity. Quite the contrary: the findings probably hint that those looking to manipulate election results do not do it on election day, but earlier. In fact, this finding is starting to be more common in the literature. Although not presented here, the pattern is repeated on each continent.
The experts rate campaign finance as the worst dimension of the electoral cycle. As I wrote on DA some months ago, campaign finance is consistently rated as the worst dimension in every single continent, whether on expert or individual data. This issue needs further attention. The second worst performing dimension in every single continent relates to media, showing unbalanced or biased coverage.
The 2016 PEI questionnaire included its first rotating module on coercion and clientelism, due to renewed concerns on such topics over the last decade. To address the former – understood as the threat or actual use of physical force designed to influence voter’s choices and behaviour – we have added four new items:
- ‘People were free to vote without feeling pressured ‘
- ‘Some voters feared becoming victims of political violence’
- ‘The process kept the ballot confidential’
- ‘Elections were free and fair’.
To address clientelism we have included three new items:
- ‘Voters were bribed’
- ‘Some people received cash, gifts or personal favours in exchange for their votes’
- ‘Politicians offered patronage to their supporters’.
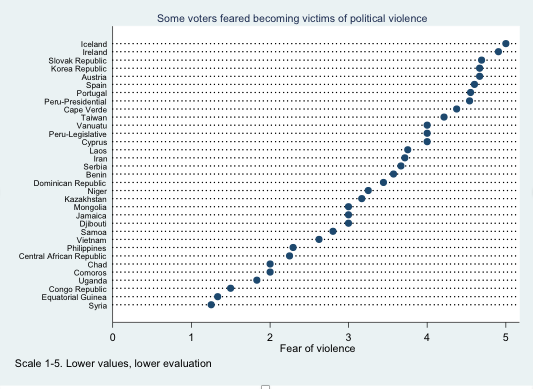
Given the importance of violations of the first order conditions of the elections (Norris, 2014), the graph on the left below shows the fear of some voters becoming victims of political violence. The worst results are no surprise: Syria is in turmoil (to say the least), while Equatorial Guinea has been suffering the brutal dictatorship of Teodoro Obiang Nguema since 1979. However, there are certain countries worth exploring given their values, such as the Philippines, Jamaica and Samoa. The scale ranges from 1 to 5.
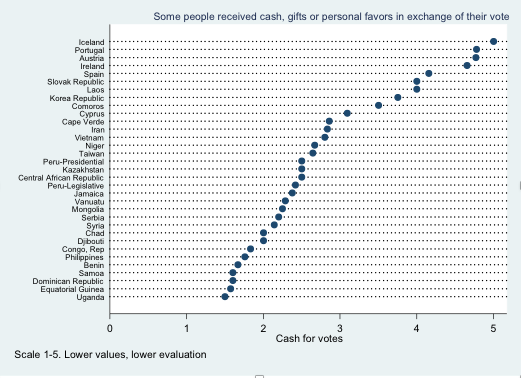
 The graph on the right below gathers the average response for this clientelism item: ‘Some people received cash, gifts or personal favours in exchange for their votes’. Higher values show higher levels of disagreement with the sentence. There are very interesting results in the lower part of the chart: Dominican Republic, for example, performs poorly.
As an anecdotal observation, years ago I spent a month in the Caribbean island and attended several party rallies. The dynamics I observed in the Dominican Republic were substantially different from those in party rallies in Australia or Spain. Results for Benin are also interesting, as its overall score on the PEI index is at the same level of many European countries. This shows that there seems to be a very clear divide in clientelist practices.
Those are just some of the very rough descriptive results that may be of interest for the general public. I encourage everyone to download and use the data. On behalf of the whole EIP team and myself, I want to thank all the experts that have devoted their time and knowledge answering our questionnaire. If you have any queries, doubts or spot any inconsistency in the data, please do not hesitate to contact us at electoralintegrity@sydney.edu.au
Note
[1] Expert is defined as a political scientist (or social scientist in a related discipline) who has published on (or who has other demonstrated knowledge of) the electoral process in a particular country. Specifically, demonstrated knowledge is defined by the following criteria: (1) membership of a relevant research group, professional network, or organised section of such a group; (2) existing publications on electoral or other country-specific topics in books, academic journals, or conference papers; and (3) employment at a university or college as a teacher. At least forty experts per country are contacted for each election, including both domestic and international experts. The domestic/international distinction was made based on institutional affiliation, citizenship, and country of residence.
This post represents the views of the author and not those of Democratic Audit.
 Ferran Martinez i Coma is a Research Associate in the Department of Government and International Relations at the University of Sydney.
Similar Posts
Subscribe
If you enjoyed this article, subscribe to receive more just like it.


 Democratic Audit's core funding is provided by the Joseph Rowntree Charitable Trust. Additional funding is provided by the London School of Economics.
Free and fair? 2016’s elections so far, ranked by integrity https://t.co/eaWD4JKwUL
Ballot-stuffing is in decline but campaign finance abuses are up – 2016’s elections so far, ranked by integrity https://t.co/TTU7Hk5XIA
https://t.co/u4eKLnFCiQ
Where were 2016’s fairest elections? Iceland, according to the latest Perceptions of Electoral Integrity data https://t.co/hr9TCWnGfb
2016’s elections around the world ranked by integrity https://t.co/3DnQ0LORtG
Free and fair? 2016’s elections so far, ranked by integrity https://t.co/JuEZqv5f2a
RT @ElectIntegrity: Ballot stuffing to campaign finance & media manipulation. EIPs Ferran Martínez i Coma analyses electoral integrity http…
Free and fair? 2016’s #electionseason so far, ranked by integrity : Democratic Audit UK
https://t.co/aznyLqeV7o
@mashanubian @KojoAbroba
Free and fair?2016’s elections so far, ranked by integrity : Democratic Audit UK
https://t.co/aznyLqeV7o
@mashanubian @wagio2010 @ekbensah
Free and fair? Find out which country ranks top for electoral integrity in 2016 https://t.co/TTU7Hk5XIA
Really interesting #integrity rankings on 2016’s #elections so far: https://t.co/WanHzvAQnc @democraticaudit #democracy #electionresearch
Syria comes bottom in the new Electoral Integrity Project index – but which country comes top? https://t.co/TTU7Hk5XIA
why are Scottish Parliament elections not on this list?
Free and fair? Looking across the world, 2016’s elections so far, ranked by integrity https://t.co/JuEZqv5f2a
Free and fair? 2016’s elections so far, ranked by integrity https://t.co/TTU7HknyA8 https://t.co/11voKkG1qE