What do the 2014 European and local election results mean for the opinion polls and next year’s general election?
As in 2009, last month’s European and local elections were held just a year before a general election. But this does not necessarily mean the results provide a guide to what will happen in May 2015. In this post, Stephen Fisher digests the election results and polling, and discusses likely implications for Westminster. He predicts that the Conservatives will lead the popular vote next year and have a 60% chance of emerging the largest party.
Jean Lambert kept her seat as the Green Party MEP for London on 22 May. Credit: helen.2006, (CC BY-NC-SA 2.0)
Labour emerged narrowly ahead of the Conservatives in both the local and European Parliament elections. I discussed the implications of the local election results in a previous post. The results of the Euros only came through last night. This post considers the lessons learnt from both elections for the general election, including the likely accuracy of the opinion polls.
The shares of the vote in Table 1 below are all comparable in the sense that they all regard voting across Britain as a whole. There are some methodological issues that explain differences (e.g. locals figures are projections from parts of England to the rest of GB; polls are polls and not votes) but the main differences are due to the kind of election.
People vote differently in locals, European and general elections. Not only is it wrong to suggest that either the local or Euro election vote share is a forecast (or even nowcast) of the general election, it was not even possible to tell what the European election result was going to be from the (earlier-released) local elections on the same day.
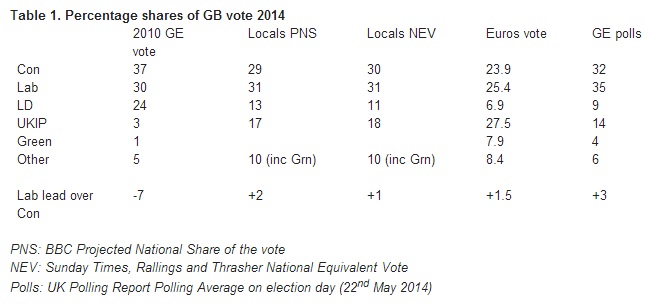
The differences between locals, Euros and general election voting follow a familiar pattern. For most countries, smaller parties do better and governing parties suffer in European Parliament and local elections relative to national general elections. These long-established phenomena are also visible in mid-term general election polls, but much more dramatically in the local and Euro elections.
In Britain, since at least 1999, more Eurosceptic parties (especially UKIP but also the Conservatives) have tended to do rather better in the European elections than in the local elections on the same day. Conversely, as the most pro-European major party, the Liberal Democrats have typically done much worse in European than general elections or local elections where they do best. This pattern was repeated again, probably more strongly, this year. It is remarkable that the UKIP share of the Euro vote was a full 10 points higher than the average of the estimates of the local election vote share (PNS and NEV).
Such and other differences between local, European and general election voting behaviour suggest general election vote intention polls are a better guide to the next general election vote share than either local or European election shares. But there are still some lessons from the elections both directly for the general election next year and for our interpretation of the opinion polls.
Protest voting and government recovery?
There is a tendency in Britain for governments to recover from mid-term setbacks. While in some respects 2009 provides a good example and basis for comparison with 2014 (both saw Euro and local elections a year before the general election) it may be an extreme case given the MPs’ expenses crisis broke during the campaign.
Nonetheless, the pattern of change in Table 2 is indicative of a more general one from other election cycles. It shows that a government recovery can be substantial. Gordon Brown managed to claw back a full 7 points in the year before the general election.
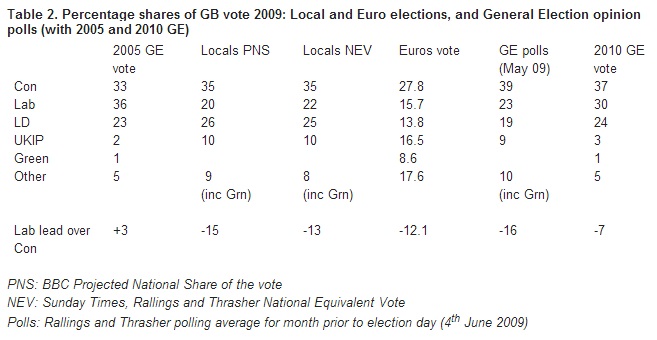
Labour’s recovery halved the lead of the Conservatives between 2009 and 2010. Although the levels of the Conservative and Labour vote shares are rather different in the polls, locals, and especially the Euros, the Conservative leads over Labour are more similar and tell the same story: mid term setback followed by government recovery, albeit not a big enough one to secure re-election.
Polling accuracy
One reason why some commentators look to local and Euro elections provide an insight into the prospects of the parties for the next election is that they are, so the cliché runs, real votes in real elections.
But opinion polls still provide the best guide. The question then is whether local and Euro elections tell us anything about the likely accuracy of the polls at the general election?
For good reasons, there were no attempts (I know of) by pollsters to forecast a national local election share of the vote. The European elections, however, provide the only opportunity before the general election to assess the ability of the pollsters to forecast the share of the vote in a Britain-wide election.
There is an excellent polling post-mortem by Anthony Wells with the detailed figures here. Some of the newer internet pollsters hugely overestimated UKIP (by 3 or more points). There were no telephone polls so we cannot say whether they would do any better. (They were not statistically significantly better or worse in 2010.) But clearly some of the higher estimates of the UKIP share in general election vote intention polls in recent years seem to be problematic in light of the Euro results.
Perhaps most importantly for the general election, all of the final Euro polls (apart from ICM) over estimated Labour and under estimated the Conservatives. The average (including ICM) of the six polls put Labour 0.8 points too high and the Tories 1.8 points too low. All suggested Labour leads of at least 3 points. More commonly the lead was 4 points, with the highest up to 7 points. The actual lead was just 1.5 points.
If this kind of bias occurs in the polls in the run up to general elections it could be seriously misleading as to the likely outcome. Even though the polls did not under-estimate Labour in 2010, it was one of just two elections since 1974 where they did not, perhaps because it was one in which Labour were at an historically low point. The polls did overestimate the Tories in 2010, and in every other election since 1974 apart from 1992.
So the direction of the bias in this year’s Euro opinion polls fits a long-standing tendency. Table 1 above also provides some indication that there may currently be a pro-Labour bias in the Labour lead in general election vote intention in the polls. Whereas the Labour leads in the PNS, NEV and Euros were between 1 and 2 points, that in general election vote intention is 3 points. Well within the bounds of statistical significance and the polls have varied, but the difference is in a direction that suggests a traditional bias might currently be in operation.
Putting the government recovery and polling bias phenomena together
My long-range general election forecasting model assumes that future bias in the polls is more likely to be what it was on average in the past than to completely disappear in 2015. As a result the forecast is for a larger forecast Tory lead in 2015 than one would expect just from the tendency for governments to recover and oppositions to fall back in the final months.
Based on the general election voting intention polling average in the table above, my forecasting model suggests the Conservatives are likely to emerge with a clear lead in the share of the vote and 60% chance of being the largest party in Parliament.
The performance of the Conservatives and Labour relative to each other in the opinion polls and elections last week provides more comfort than concern for quality of the model. Chris Prosser’s model forecasting general election results from local election results alone produces a remarkably similar forecast share of the vote.
The biggest risk for the model is not so much that UKIP might get a very large share of the vote in 2015: they are already forecast to get 12%. Rather it is the (broadly) uniform national change assumption that looks like potentially being the weakest link.
One key question is which of the two main parties UKIP will take votes of more in the key marginals compared with overall. As discussed here, it currently looks like the overall damage to the two main parties from UKIP is roughly equal. Even if it was not, the overall hit is reflected in the overall share of the vote and so in the uniform change projections. More importantly, there was no evidence in the local election results that the swing between the Conservatives and Labour was any different in marginal constituencies to elsewhere.
The second question is whether UKIP can mount successful campaigns to win particular constituencies. Even on the basis of their stunning results last week, it will be difficult for them to win more than a dozen, or even a handful, of seats in the Commons. The party has proved its ability to organize, but the UKIP vote is geographically less flat, but even in this year’s elections their highest peaks were still lower than those of the main parties.
—
Acknowledgements: Thanks to the BBC, John Curtice, Rob Ford, Jon Mellon, Rosie Shorrocks, and Michael Thrasher for their help with both data and analysis.
Note: This post was originally publish on Elections etc. It represents the views of the author and does not give the position of Democratic Audit or the LSE. Please read our comments policy before responding.
—
 Stephen Fisher is Associate Professor in Political Sociology and the Fellow and Tutor in Politics at Trinity College, University of Oxford. Follow him on Twitter @StephenDFisher
Similar Posts
Subscribe
If you enjoyed this article, subscribe to receive more just like it.


 Democratic Audit's core funding is provided by the Joseph Rowntree Charitable Trust. Additional funding is provided by the London School of Economics.
60% chance now of Tories as first party after 2015 GE
#indyref
#goforitscotland
https://t.co/dxYfDN4YcY
Para los que se les llena la boca haciendo predicciones vacuas: https://t.co/H2yRXjyO9W via @democraticaudit
Euro and local election results not a reliable predictor of 2015 General Election performance https://t.co/3EXMbttIQy
RT @EdwardHarkins: ‘Torys have a 60% chance of emerging as largest party in #2015election’ @StephenDFisher #indyref via @PJDunleavy https://…
Know what Scotland?
There’s a serious 60% chance of Tory govt
coming your way if you vote #indyref No
Check the figs
https://t.co/lzwR9mmSoh
What do the 2014 European and local election results mean for the opinion polls and next year’s general election? https://t.co/2tV9KKXQOO
Conservatives have a 60% chance of emerging as largest party in general election, forecast from @StephenDFisher https://t.co/UV90OEvxAp
What do the 2014 European and local election results mean for the opinion polls and next year’s general election? https://t.co/tO0DM861pF