‘Super Thursday’ tells us a lot about voter participation in the UK
Thursday 5 May saw a host of elections happening around the UK, on an unprecedented scale outside of a General Election. Democratic Dashboard’s Carl Cullinane looks at what the election campaign tells us about the state of voter participation in the UK.
With the announcement on Sunday evening that Labour had captured control of Bristol City council, a UK-wide marathon count lasting almost 70 hours finally drew to a close. During that time, an election of unprecedented scale outside of a General election year saw 129 Members of the Scottish Parliament, 60 Welsh Assembly Members, 108 Northern Ireland Assembly Members, 25 London Assembly Members, 4 Mayors, 40 Police and Crime Commissioners, 2 MPs in by-elections and 2,769 councillors, across 124 councils, elected. Conducted in the shadow of a huge vote on membership of the European Union, what have we learned from ‘Super Thursday’ and its lead up in terms of sub-national politics and voter participation in the UK?
State of the parties
Unlike the often straightforward results of a General Election, the party political outcome from Thursday has been very much a mixed one, with Labour suffering severe losses in Scotland, and being pushed into third position by the Conservatives, but largely holding on to their councils in England, and also securing a morale boosting win in the London Mayoral race. The SNP polled strongly in Scotland, but suffered a seat loss largely due to tactical voting by their opponents and an electoral system that corrects for the influence of large parties.
UKIP made significant advances in the English council elections, almost doubling their number of seats, and, more notably, the Welsh Assembly, coming from holding no seats at all, to capturing seven. Capitalising on the fact that the EU referendum is at the forefront of voters’ minds, this was no surprise. While the Conservatives could be very satisfied with their performance in Scotland, they nonetheless failed to make any progress in England or Wales. However, in the context of a difficult time for the party recently, they will feel encouraged by a Labour party failing to make the inroads usually seen by an opposition party at this stage of the electoral cycle.
Electoral participation
Participation and turnout was overall either strong or neutral, despite early warnings on election day. Scotland and Wales both saw their second highest turnout in devolved elections, and turnout in the London Mayor election was also up, with Sadiq Khan achieving the most votes of any individual candidate in UK electoral history.
Turnout in PCC elections was also up substantially. After a dismal 15.1% turnout in November 2012, the average turnout this time around was 26.4%, with turnout in the Welsh Police Areas, which had concurrent Assembly elections, between 40% and 50%. This is certainly good news for the legitimacy of the institution, and highlights the value of holding the elections on the same day as other polls. However, one interesting side effect of this has been the decrease from 11 Independent PCCs in 2012 to just 3 in 2016. With more voters turning up to vote in Welsh Assembly and Local Council elections at the same time as the PCC vote, this has coincided with increased party partisan voting.
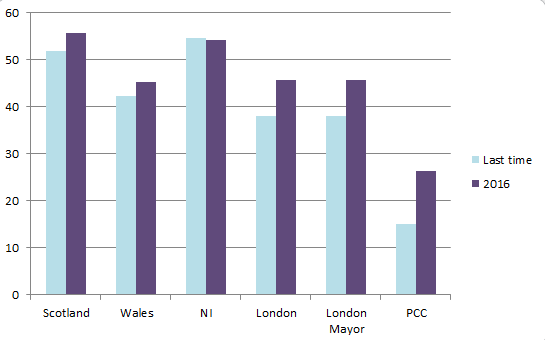
Figure 1. Voter turnout in 2016 compared to previous election
Voter Engagement
Given the almost across-the-board increases in turnout, it would seem that ‘Super Thursday’ has been a success for voter participation. It was been a strange campaign however. With the EU referendum dominating the news cycle since March, there has been very little media focus on the May elections. Column inches that would usually have been taken up by analysis of what the English local elections might mean for Jeremy Corbyn’s leadership, the prospects for UKIP in England and Wales, or the introduction of Votes at 16 in Scotland, were instead entirely focused on narratives and stories around the EU vote and its political consequences. In fact the media didn’t seem to switch on to the scale and importance of the Super Thursday vote until the 48 hours before the polls opened. Accordingly, voter awareness of these elections seemed to remain extremely low during what could be termed the ‘campaign’ period.
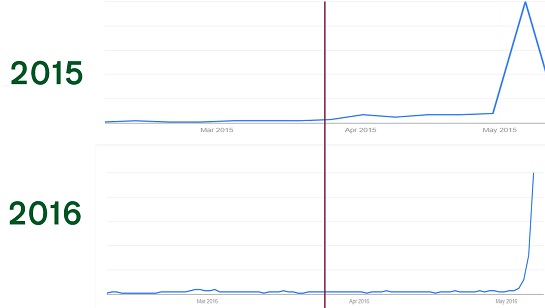
Figure 2. Google Trend Data of searches for the term “election” 2015 & 2016
The Google Trend data bears this out. Figure 2 (below) shows a graph of searches for the term “election” within the UK between February and May in 2015 and 2016. You can clearly see the increased interest from the beginning of the election campaign 6 weeks out in late March 2015 (the red line). However, in comparison, 2016, apart from some minor fluctuations, saw no increase in search activity about the elections from early February, right up until 3 or 4 days before the election, when it finally exploded.While this is obviously a limited way of measuring public interest in an election campaign, it is nonetheless illustrative. While it is encouraging that this apparent lack of public engagement did not lead to particularly poor turnout rates, it does perhaps say something about the quality of information and engagement provided by the political establishment and the mass media in advance of these elections. Google Trends graphs are relative rather than absolute, so to put this in context, the May peak in 2015 is five times higher than the May peak of 2016, as shown in Figure 3 (below).
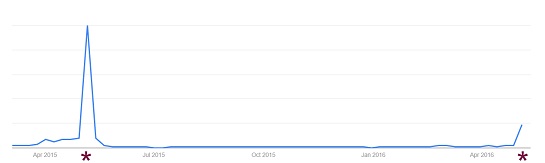
Figure 3. Google Trend Data of searches for the term “election” 2015-2016. *Election day
The Dashboard
Our usage statistics from the Dashboard follow a very similar pattern, with visitor numbers largely very stable until the 48 hours before the election, when we had a huge spike. We had over 100,000 pageviews on election day alone, double what we achieved on election day last year. This year’s Dashboard has provided a very interesting comparator with last year’s experience. We have very much enjoyed covering these elections, and look forward to doing so into the future, hopefully becoming a fixture for voters in the UK seeking information about elections in their area. In the meantime, over the next couple of weeks we will be gathering and uploading this year’s results to the site, and offering some further reflections on the elections on our blog.
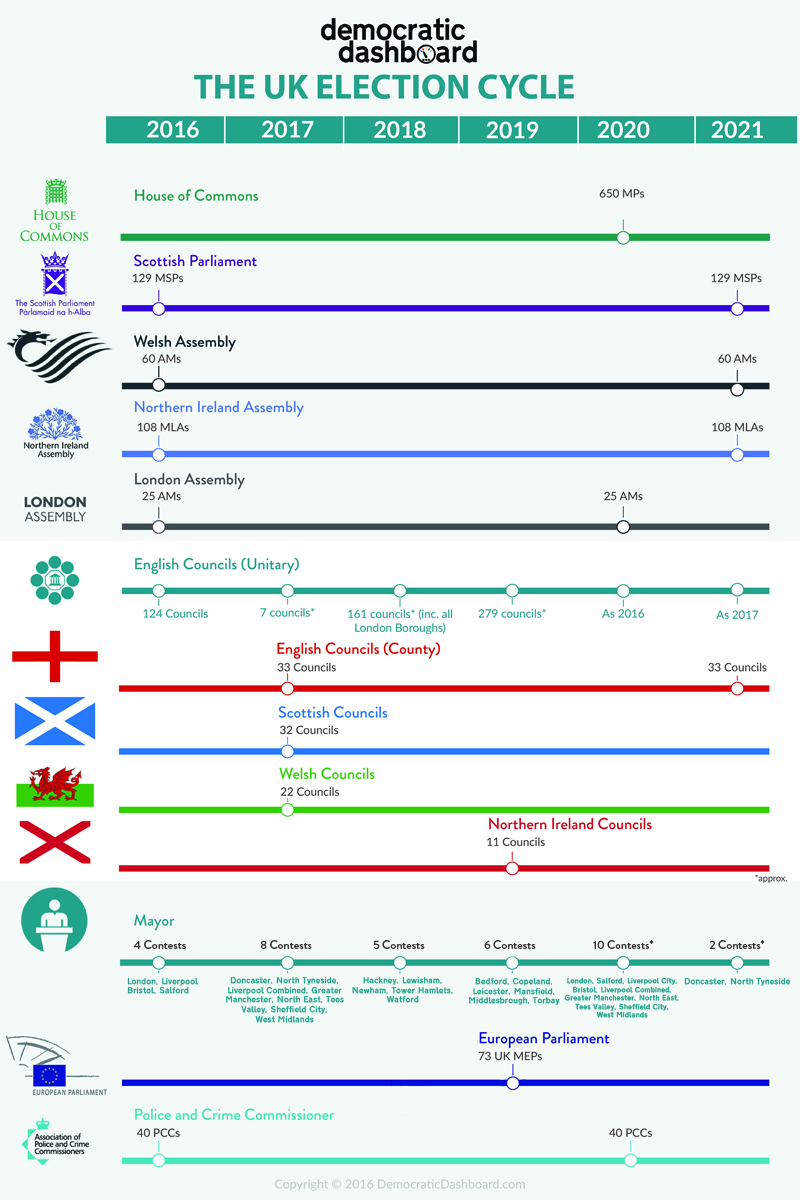
As you can see from our infographic (below), next year sees local elections in Scotland, Wales and English County Councils, along with the first elections for the new ‘Metro Mayors’ in Greater Manchester and elsewhere. While we prepare for 2017, we would be delighted to hear your feedback on the site our coverage of the 2016 elections. Please send any thoughts to democraticdashboard@gmail.com.
—
 This post originally appeared on the Democratic Dashboard blog.
This post represents the views of the author, who writes in a personal capacity, and not those of Democratic Audit or the LSE. Please read our comments policy before posting.
—
 Carl Cullinane is Research Manager at Democratic Audit UK and Project Lead for the Democratic Dashboard
Similar Posts
Subscribe
If you enjoyed this article, subscribe to receive more just like it.


 Democratic Audit's core funding is provided by the Joseph Rowntree Charitable Trust. Additional funding is provided by the London School of Economics.
[…] illustrate current events is synonymous with the press. Everything from graduate job prospects to voter participation can be neatly broken down into easily digestible chunks of high quality data, allowing comparisons […]
An insight into trends by @democraticaudit for 2016 #elections compared to previous years https://t.co/gwW5QcbW1M. https://t.co/XZ5OjyrkZ1
See @DemocraticDash’s @CullinaneCarl on what the #SuperThursday elections show us about the UK’s #voterparticipation https://t.co/svTF6Gd0uL
From @democraticaudit: turnout in 2016 compared to last time. Encouraging signs: https://t.co/NbGR6zon9M https://t.co/CyQoOqTL7K
‘Super Thursday’ tells us a lot about voter participation in the UK https://t.co/NbGR6zon9M
‘Super Thursday’ tells us a lot about voter participation in the UK https://t.co/DhGHLiCiXm
‘Super Thursday’ tells us a lot about voter participation in the UK https://t.co/m51rwJ2o1g
‘Super Thursday’ tells us a lot about voter participation in the UK https://t.co/xtvxy1CRLG
‘Super Thursday’ tells us a lot about voter participation in the UK https://t.co/CH3g6TnJgC https://t.co/gx3w5Pr1X7