Representative samples are an issue for the pollsters – but so are respondents who lie
The British Polling Council recently published their report about what went wrong with the polls in the 2015 general election. The report dismissed problems associated with voter registration, question wording, postal voting and mode of interviewing and opted for unrepresentative samples as the key factor in explaining what happened. Here, Paul Whiteley and Harold Clarke make the case for examining another factor: respondents who don’t tell the truth.

Credit: Garry Knight, CC BY 2.0
For statisticians, random samples are the ‘gold standard’ if one wants to get an accurate picture of how people will vote. The theory is straightforward: if every voter has an equal chance of ending up in the sample – no matter how small – then that sample should give us an accurate picture of the electorate. No significant group of people will be left out because they all have a chance of being interviewed. In contrast, quota samples require interviewers to find groups of respondents with combinations of socio-demographic characteristics that match census profiles of population sub-groups. By doing so, quota samples attempt to mimic random samples but, as any statistician will quickly argue, they are not the same.
So, how do the pollsters go about getting random samples? One method used in telephone surveys is to dial numbers at random and in theory this should provide the desired sample, albeit of people with telephones. Unfortunately, response rates for such exercises are now very poor, in some cases falling below 10 per cent. People increasingly screen out marketing calls or merely hang up the phone regarding telemarketing as a nuisance. So achieved samples are very different from the ideal of a random sample. It is quite heroic to assume that the small percentage of people who do grant a phone interview are a random subsample of those who were originally contacted.
A similar point can be made about surveys conducted by interviewers in the respondent’s home – so-called face-to-face surveys. The samples for these are selected randomly but they increasingly fail to interview many of the people on the list, which produces a biased sample. An example of this is the 2015 British Election Study which achieved a response rate of only 55.9 per cent in its face-to-face survey conducted after the election. This is well down on the response rates achieved by the study thirty years ago. Nor is this just a British problem. The response rate for the 2012 American National Election Study was only 38 per cent. Again, it is difficult to imagine that those who do participate in face-to-face surveys are a completely random sub-sample of the original sample chosen for an interview.
Internet surveys take a different approach and use quota samples, obtained by signing up people to do a certain number of surveys each month. These internet panels are usually very large and, not surprisingly, don’t tend to be fully representative of the population. Polling companies can deal with this problem in two ways. One is by selecting people from the panel in light of census information, data on media consumption patterns, and party support so that an achieved sample is steered in the direction of being representative of the country as a whole. A second approach is to weight the data afterwards, so called ‘post-stratification weighting’. There are a variety of schemes for doing this, but they all involve counting some hard-to-reach respondents as being more important than the easy-to-reach ones. Both of these strategies are used to try to approximate a random sample.
The 2015 British Election Study (BES) did both internet and face-to face surveys in Great Britain after the election to see how people voted. So, direct comparisons can be made between the two, to see how accurate they were in measuring parties’ vote shares. The face-to-face survey reported that Labour got 32.6 per cent of the vote and the internet survey reported 34.3 per cent. Since Labour actually took 31.2 per cent of the vote, the face-to-face was more accurate. In the case of the Conservatives, the face-to-face survey said that the party received 40.6 per cent, and the internet survey reported 34.8 per cent. Given that the Conservatives actually obtained 37.7 per cent, the errors for the two modes of interviewing were exactly the same at 2.9 per cent. Differences for the other parties were very small, with the BES in-person and internet surveys missing the Liberal Democrat, UKIP, Green and SNP vote shares by averages of 1.1 per cent and 1.0 per cent respectively. None of these differences for the minor parties are statistically significant. Overall, the BES post-election face-to-face survey was better than the BES post-election internet survey only in the case of the Labour vote.
These comparisons are for post-election surveys. What about pre-election polls commentators employ for election forecasts? The face-to-face mode is a non-starter for these polls: they take literally months to collect. The 2015 BES in-person survey was in the field from May 8th to September 13th. Face-to-face surveys are also hugely expensive, far beyond what a survey firm could expect a client to pay, even on a one-time basis. In practice, pre-election surveys have to be done using telephone and internet polls. Is there evidence that one of these modes is preferable?
When making this comparison it is possible to take advantage of the large number of telephone and internet surveys conducted during the five years between the 2010 and 2015 elections. A total of 1,942 polls were conducted during this period and, with the assistance of some multivariate modelling, we can identify latent voting intentions underlying the data. These latent vote share variables separate out the ‘signal’ from random noise in a large number of opinion polls and so capture the true levels of support for various parties better than any single poll could do. Using this approach, we can see if telephone and internet polls differ when it comes to measuring true voting intentions over time.
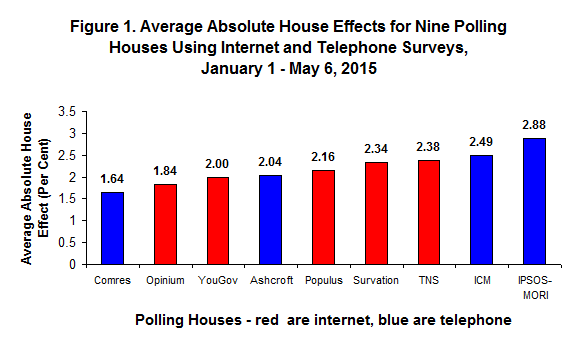 Figure 1 shows the average ‘house’ effects or errors associated with different survey companies alongside the ‘mode’ effects, or errors associated with using telephone as opposed to internet surveys. The figure shows that some survey houses had a better track record than others, but they were all within the standard margin of error of 3 per cent associated with the average poll. The average error for telephone surveys was 2.3 per cent, and for internet polls it was 2.1 per cent, and so the difference is negligible. The statistical evidence in Figure 1 indicates that some survey houses were more accurate than others, but does not demonstrate the superiority of the telephone mode to internet or vice versa.
All this creates a problem for explaining why the polls got it wrong in 2015. If there are no differences between the errors in telephone and internet surveys and face-to-face surveys would not greatly improve matters – even supposing they could be done in a cost-effective and timely way – why did the polls get it wrong in 2015 when they got it right in 2010 and in earlier elections? This is a puzzle given that problems of getting accurate measures of public opinion are not new but have existed for many years. The answer that the Polling Council gave is that the samples polling houses use are less than optimal and may have deteriorated in recent years. Certainly, this advice is worth heeding. But, there may be another reason as well.
There is another possible explanation which has been neglected in the analysis of what went wrong in 2015. Writing shortly after the polling debacle in 1992, Ivor Crewe suggested that Britain was becoming ‘a nation of liars’. He may have been onto something. Not only is it becoming more difficult to get respondents to participate in surveys, it also may be that those who do take part are more likely to lie to interviewers about whether they voted. This was not a problem for the 2015 election night exit poll which got the result close to spot on. For this survey it was clear that all of the participants actually voted because they were interviewed right after leaving the polling stations. This is not true for individuals who respond to pre-election polls. If these polls are picking up more and more people who claim they will vote or have voted, but in reality this is not true, this will widen the gap between reported voting intentions and what actually happens on election night.
In the 2001 and 2010 British Election Studies respondents interviewed in the ‘gold-standard’ post-election face-to-face surveys were asked if they had voted in the election. The BES team then organised voter validation exercises to find out who actually cast a ballot. This was done by inspecting records on electoral participation which are held by the state for legal reasons. The records make it possible to identify if someone voted, but not of course how they voted. Using these data it is possible to document the number of respondents who ‘misreported’ their electoral participation to the BES interviewers.
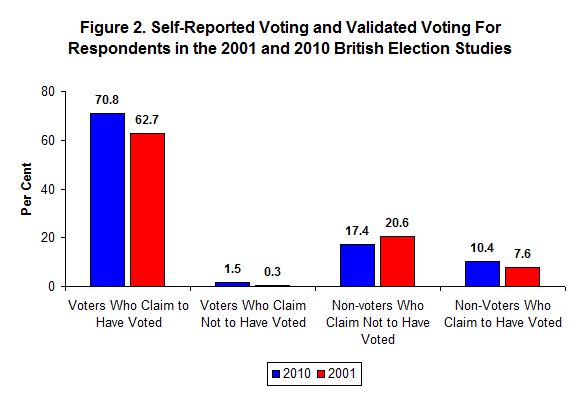 Figure 2 shows that in 2001 62.7 per cent of the respondents truthfully claimed to have voted in the election compared with 70.8 per cent who did so in 2010. In addition, 20.6 per cent truthfully recorded that they did not vote in 2001 and 17.4 per cent did so in 2010. The most interesting group are the non-voters who falsely claimed to have voted in each of the elections. There were 7.6 per cent of these ‘false positives’ in 2001 and 10.4 per cent in 2010—a 36.8 per cent increase. ‘False negatives’ – people who claimed not to have voted when they actually did – was a much smaller group in both years. Again, the false nonvoters increased across the two elections, from 0.3 per cent in 2001 to 1.5 per cent in 2010.
These figures documenting the incidence of false reports come from two face-to-face post-election surveys, but there is no reason to believe that misreporting is confined to people participating in in-person surveys or post-election surveys. Indeed, since the over-reporting of voting turnout is considerably greater for internet and telephone polls than it is for face-to-face surveys, the problem of lying is potentially greater for these survey modes. More generally, if the number of people lying about whether they have or will cast a ballot continues to increase, then polls of whatever mode are going to become more inaccurate over time.
The upshot is that pollsters would be well-advised to pay more attention to developing accurate ‘likely voter’ models. Working to improve the overall quality of survey samples as the British Polling Council suggests should help, but there is still a problem for those wishing to use pre-election polls for forecasting purposes if a sizable number of respondents, however sampled, do not tell the truth about whether they actually cast a ballot. Developing effective likely voter filters to cull the liars promises to be a cost-effective way to improve the accuracy of pre-election polls.
—
This post originally appeared on the LSE Politics and Policy blog. It represents the views of the authors and not those of Democratic Audit UK or the LSE. Please read our comments policy before posting.
—
 Paul Whiteley is Professor in the Department of Government, University of Essex
 Harold D. Clarke is Professor in the School of Economic, Political and Policy Sciences, University of Texas
Similar Posts
Subscribe
If you enjoyed this article, subscribe to receive more just like it.


 Democratic Audit's core funding is provided by the Joseph Rowntree Charitable Trust. Additional funding is provided by the London School of Economics.
Representative samples are an issue for the pollsters – but so are respondents who lie https://t.co/3hUbj4ga6v
Representative samples are an issue for the pollsters, but so are respondents who lie https://t.co/IyzAFlXjvu
Representative samples are an issue for the pollsters – but so are respondents who lie https://t.co/ymojbRVVeT
Representative samples are an issue for the pollsters – but so are respondents who lie https://t.co/joiVU2QlY9
Representative samples are an issue for the pollsters – but so are respondents who lie https://t.co/I5eZoBEU3k
Compelling research by Paul Whiteley & @HaroldDClarke showing real reason that pollsters got it so wrong: LYING! https://t.co/vfARjp72LA
Representative samples are an issue for the pollsters – but so are respondents who lie https://t.co/qOyzMfLrwB https://t.co/DQWBtRx53m