The UK has just held a General Election – but how democratic are we as a country?
Democratic Audit UK has long led the way in assessing the health, strength and durability of UK democracy, with the 2012 Audit of Democracy showing worrying trends and highlighting the numerous systemic problems with the UK’s constitutional and political settlement. Here, Karima Bousbah, Miriam Hänni, Lea Heyne, Lisa Müller and Saskia Ruth apply a new method for calculating the democratic strength of different countries to the UK, finding a modest upswing in our credentials as a country since the late 1990s.
1) The overall quality of democracy
The Democracy Barometer is a new tool to measure the subtle differences in the quality of established democracies. It consists of a stepwise theoretical deduction of fundamental elements of democracy. The starting point is the premise that a democratic system tries to establish a good balance between the normative, interdependent values of freedom and equality and that this requires control. In order to guarantee these three fundamental principles and thus the quality of democracy, nine democratic functions need to be fulfilled.
We argue that the quality of a given democracy is high when these nine functions are fulfilled to a high degree. However, a simultaneous maximisation of all nine functions is not possible, not only because of the tensions between freedom and equality, but also because democracies are systems whose development is perpetually negotiated by political as well as societal forces. Hence, democracies weigh and optimise the nine functions very differently. In this contribution we take a closer look at how the United Kingdom deals with this challenge.
Figure 1: Democratic Quality Index 1990-2012
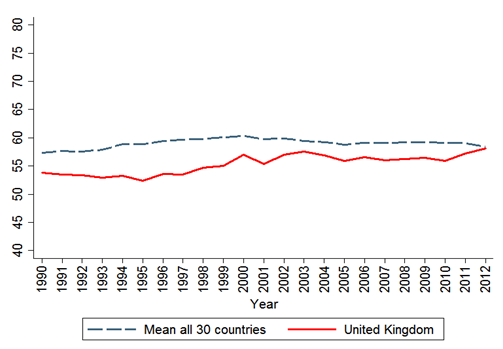
Figure 1 compares the average democratic quality among the 30 most established democracies around the world with the democratic quality in the United Kingdom. Although the United Kingdom’s quality of democracy lies constantly below the average we can observe an improvement in the UK’s quality of democracy in the second half of the 1990s, bringing its score closer to the average quality among established democracies. This trend continues until the UK meets the average in 2012. Especially after the elections in 2010, democratic quality is increasing. In the following, we will discuss the reasons behind this upswing.
2) Freedom
The principle of freedom performs slightly above average, and varies only little over time. Between 1990 and 2010, a slow but continuous downward trend can be observed, which however seems to come to an end since 2011 (see Figure 2).
The function individual liberty exhibits the most volatile pattern. The temporary dip in 1991 can be explained by a number of riots during that year – e.g. the Carlton leach riot in Essex or the Petrol riots in Cardiff – and increased torture. The decline of the indicator measuring torture was most likely caused by the misbehaviour of the police of Northern Ireland, which was alleged of the ill-treatment of a suspect in 1991. The sudden decreases of individual liberties in 1995 and in 2001 might again be associated with riots that took place in these years. In 1995, the so-called Brixton riots were ignited by the death of a young black man in police custody.
In 2001 continuing violence between Caucasians and South Asians led to riots in Bradford which lasted for two days and left many people injured and property damaged. There were additional riots in the same year, which added to the decline of the function: e.g. the Oldham race riots and the Harehills riots. All of these riots resulted from conflicts between different ethnic groups. By contrast, the declines in 2007 and 2010 can most likely be attributed to new restrictions regarding the freedom of religion. Controversial were especially newly introduced dress code restrictions in schools (e.g. Muslim school girls were not allowed to wear full-face veils in school, but there were no restrictions on headscarves).
Figure 2: Principle of Freedom
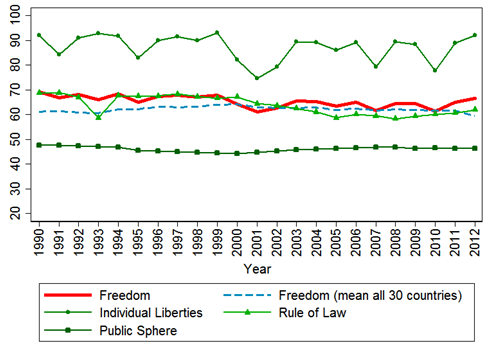
In contrast to the function individual liberties, the remaining functions vary only slightly over time. However, the low level of the function public sphere is striking and needs to be explained. It seems that the low level of the function public sphere results from the fact that the United Kingdom has no constitution. Consequently, there are no constitutional provisions concerning the freedom of speech, press, assembly and association. Furthermore, the UK does not perform well with regard to the diversity of its press system, both quantitatively and ideologically. These factors contribute to the low development of the public sphere function.
By contrast, the function rule of law scores on a higher level. The country’s strengths lie foremost in an independent, professional and impartial justice system. From 2000 onwards, the function declined slowly but steadily, which can be attributed to a worsening in the assessment of judicial and legal independence, integrity and fairness. This development might be related to the introduction of the 2000 Terrorism Act that restricts certain rights, usually granted to all detainees or defendants, for terrorism suspects. Yet, we can also observe a slow rebound since 2008, as the evaluations of judicial independence are increasing again.
3) Control
The principle of control exhibits a rather poor performance compared to the average of all 30 countries under investigation (see Figure 3). As the graph reveals, it decreased in 1997 and remained on a lower level until it increases again since 2005, getting closer to the mean value of all countries in 2012. As the pattern above indicates, this development is mainly due to the functions competition and mutual constraints.
Both declines might be attributed to the general elections of 1997. Regarding the function competition, the elections resulted in a larger difference between the seat shares of the two largest parties (Labour: 418; Conservative: 165). This development negatively affected various indicators measuring competition. The improvement of the function in the years following the elections of 2001 and 2005, in turn, was caused by the comparatively close electoral outcome. With the elections in 2010 and the establishment of the liberal democrats in the parliament, the closeness of electoral outcomes and hence the competition function has become even better. Nevertheless, the function competition remained on a rather low level. More generally, the British “first-past-the-post” system might explain the rather low level of the function competition as it leads to a lower number of parties and a higher disproportionality in the vote and seat distribution, which negatively affects several of our indicators.
Figure 3: Principle of Control
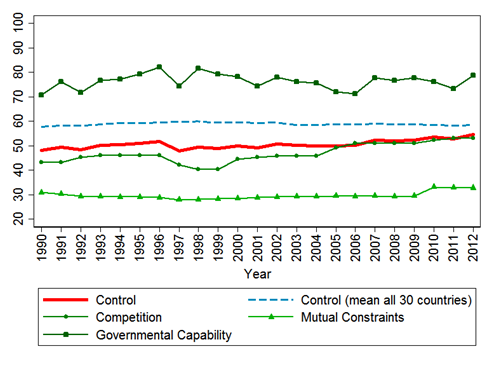
Considering the function mutual constraints, its low scores are striking. While the downturn of 1997 is also caused by the elections, which led to a lower balance between the government and the opposition, the generally poor performance reflects primarily the lack of federalism and judicial review in the United Kingdom. However, we can see that since 2010 mutual constraints show an upturn, caused by a better balance between government and opposition following the last elections.
Despite some temporary dips, i.e. in 1997, 2001 and 2005/2006, the function governmental capability shows the highest performance of the three functions of the principle control. The elections of 1997 ended an upwards trend, which was mainly caused by steadily increasing government stability. On the one hand, the elections led to a cabinet change. On the other hand, the first Blair government was less stable than the previous one. The decrease in 2001 resulted from that year’s general elections, which led again to a major cabinet change and thus negatively affected the government’s stability (even though Tony Blair was re-elected as Prime Minister). More important, however, was an increase in violent and non-violent anti-government actions in the same year. Of course, this development can be associated with the riots mentioned above. The decline of the function between 2007 and 2011 is foremost caused by the government change in 2007. Tony Blair resigned without holding new general elections and was succeeded by Gordon Brown. Yet, in 2012 the government capability increased again, due to better values for the effective implementation of government decisions.
4) Equality
In comparison to the other principles, equality displays more variation over time, as can be seen in Figure 4 below. The principle scores considerably under the average value in the early 1990s, and dropped even more from 1992 onwards. In 1998, however, the United Kingdom’s level of equality started to increase leading to the maximum value (slightly above average) reached in 2000 and 2002. Afterwards, the principle shows a slight downward trend again, and establishes closely below the average of the 30 countries analysed.
Figure 4: Principle of Equality
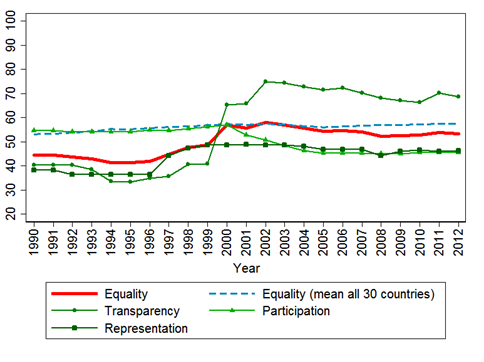
The initial downward and upward pattern (1990-2000) can mainly be explained by the development of the functions representation and transparency, whereas the downward pattern in the 21st century is associated with a decrease on the participation function. The downward trend in transparency in 1992 can be associated with a more restrictive legal and political environment for the media. However, the situation seems to have improved again between 1995 and 1998, which is indicated by higher levels of the respective indicators. Even more relevant for the upward trend of transparency was the increase in the transparency of government communication. This development might be attributed to the publication of a White Paper in December 1997, which outlined a new freedom of information act.
The act allows for public access to (a majority of) official information and improves “individual access to personal information”. Furthermore, the year 2000 saw the introduction of more stringent transparency rules on the disclosure of contribution to and finances of political parties. In 2001 a second massive increase of the function can be observed. Following the White Paper of 1997, the “Freedom of Information Act” was finally implemented in 2000, which positively affected the two indicators measuring freedom of information. For the remaining period under investigation the function remained more or less stable, with another increase in 2011, caused by a better assessment of the transparency of governmental policies towards the electorate.
In the early 1990ies, the function representation developed somewhat parallel to transparency. The first decline in 1992 is related to that year’s general elections. It seems that the congruence between parties and voters regarding their left-right position declined compared to previous or later elections. Consequently, the improvement of representation in 1997 is related to the subsequent general elections. Furthermore, the elections led to a better representation of women in parliament. However, in spite of these developments, the country shows a comparatively low level of representation. This can be explained by the rather small share of women in parliament and government, a low number of parliamentary seats per inhabitant and comparatively high constraints regarding passive suffrage. All of these factors have not changed in the elections of 2001, 2005 or 2010.
By contrast, the function participation remains stable until the 2001 general elections; afterwards a steady decline sets in. This development is determined by lower turnout levels in parliamentary elections, which consists up to 2012.
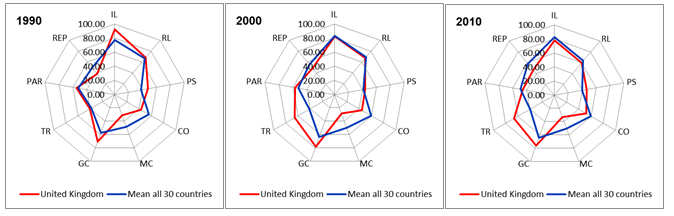
The democracy profile of the United Kingdom
In contrast to the first figure above, the graphs below show more variation over time (see Figure 5). While the overall quality of democracy remained more or less stable in the United Kingdom, its shape changed considerably over time. In 1990 participation was better developed than in 2010; whereas transparency increased significantly between 1990 and 2010. Similarly, representation improved over the period under investigation. The remaining functions stayed approximately on the same level. This development illustrates that many different forms of democracy are possible and that the pattern might change significantly over time, which underlines the multidimensionality of democracy.
Figure 5: Democracy Profile
—
See www.democracybarometer.org and this previous Democratic Audit UK post for more information.
Note: this post represents the views of the author, and not those of Democratic Audit or the LSE. Please read our comments policy before posting.
—
 |
Karima Bousbah is a Project Assistant at Democracy Barometer |
 |
Saskia Ruth is a Postdoctoral Fellow in Political Science at the NCCR Democracy at the University of Zurich and the Center for Democracy Studies in Aarau. |
 |
Miriam Hänni is a Project Assistant at Democracy Barometer |
 |
Lea Heyne is a Research Assistant at Democracy Barometer. Her University of Bern profile can be found here. |
 |
Lisa Müller works on the Democracy Barometer project. Her University of Zurich profile can be found here. |
Similar Posts
Subscribe
If you enjoyed this article, subscribe to receive more just like it.


 Democratic Audit's core funding is provided by the Joseph Rowntree Charitable Trust. Additional funding is provided by the London School of Economics.
Colleagues of mine from the University of Zurich/the Democracy Barometer assess the quality of democracy in the UK | https://t.co/zIBgFLnYbB
https://t.co/uVW6vQ5tSA
RT @democraticaudit: The UK has just held a General Election – but how democratic are we as a country? https://t.co/qM0DPDKGH7
The UK has just held a General Election – but how democratic are we as a country? https://t.co/k96crBwzz7
The UK has just held a General Election – but how democratic are we as a country? https://t.co/I1SzjIu5zc | @democraticaudit | #GE2015
Following #GE2015, just how democratic is the UK? Democracy here is improving says this @democraticaudit blog: https://t.co/oK168nZ9Bf
The UK has just held a General Election – but how democratic are we as a country? https://t.co/gtWraIS0P6 #Option2Spoil
The UK has just held a General Election – but how democratic are we as a country? https://t.co/jRfrmdOwD8