General election polling goes geographical: the accuracy and value of constituency-level estimates
The 2017 general election saw a largely unremarked geographical extension to opinion polling, with three analysts publishing estimates of which party was likely to win in each of the country’s constituencies. Ron Johnston, Kelvyn Jones, David Manley, Charles Pattie, Todd Hartman, and David Rossiter have analysed their accuracy and considered the implications of that development for the conduct of future elections.
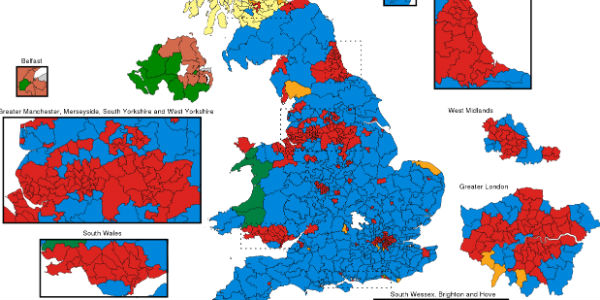
Constituency result map, 2017. Image: RaviC via Wikimedia Commons/(CC BY-SA 4.0)
As a general election approaches, the media, the voters and – more than anybody else – the political parties focus their attention on the polls: they want to know not only each party’s likely share of the vote but also its probable number of MPs. For many years, the latter could only be estimated by predicting seat numbers from vote shares, but this was an inexact science because of the varying disproportionality between the two. As a result, even if national polling produced good estimates of each party’s vote tally, the predicted allocation of seats was often less accurate, resulting in surprise when the actual results were published – or, at recent elections, when the results of the (remarkably accurate) exit polls conducted for the main broadcasting companies.
These relative failures reflected that polling companies lacked the resources to conduct large, representative surveys across all constituencies. There was some polling in places of particular interest – notably marginal seats where parties were intensively canvassing – but no overall picture of the outcome across every constituency.
The recent shift to internet polling has changed that: thousands of voters can be surveyed daily, with the data collated and the results reported very rapidly – and frequently updated as more data come in. Furthermore, the wealth of data contains material from voters in virtually all constituencies. These are not random samples of each electorate, but with sophisticated methods for combining polling data with other information – on each constituency’s population profile, for example, and the results of previous elections there – the probable outcome in each seat can be estimated using what is known as Multi-Level Regression and Post-Stratification (MRP). But with what accuracy?
In the run-up to the 2017 general election two pollsters, YouGov and Lord Ashcroft, used their accumulated data to produce such estimates which they published online. They were joined by an academic analyst, Chris Hanretty, who lacked access to continued polling data but deployed the same methodology using publicly available survey data.
How reliable were their assessments? We downloaded their final estimates (on the eve of polling day for YouGov and Ashcroft) of each party’s share of the votes in each constituency, and of which party was predicted to win there. The short answer is that they were generally very accurate. The first two graphs show examples of how well YouGov and Lord Ashcroft predicted parties’ constituency vote shares: if they were totally accurate, then all of the points (each representing one constituency) would fall on the diagonal line which represents perfect prediction.
 The first graph reveals that almost all of Ashcroft’s predictions of the Conservatives’ share were quite close to the actual outcome, though there was a tendency to over-estimate (more of the points were below the diagonal than above it). Similarly, the second graph shows that YouGov was very good at predicting Labour’s outcome, although it tended to underpredict the party’s performance in seats where it did especially well (most of the points at the right-hand end of the graph are above the diagonal).
All three analysts were very successful in putting constituencies in the right order according to each party’s share of the votes. In many ways that is not surprising. Most British constituencies are safe for one party – the likelihood of another winning there is remote. General elections are won and lost in only a minority of seats – the marginal constituencies. How well did they perform in estimating which party would win there?
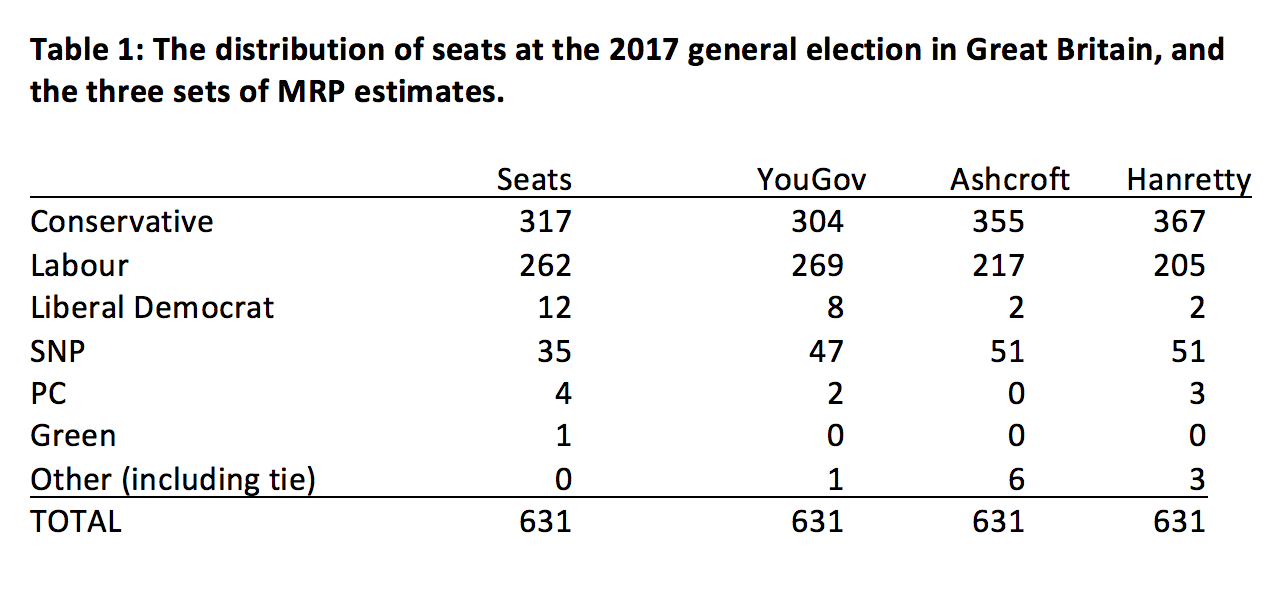 The table shows each party’s number of seats in Great Britain (excluding that occupied by the Speaker), and each analysts’ estimates. (There were none for the 18 Northern Ireland seats.) YouGov got most right – 93%; it slightly over-estimated Labour’s tally and, like the others, substantially over-estimated the SNP outcome. Ashcroft (88% correct) and Hanretty (86%) substantially over-estimated the Conservative performance and underestimated Labour’s. To be right in the great majority of cases is a substantial achievement, but each got the overall outcome wrong, because they wrongly estimated the winner in many of the marginal constituencies.
There were 85 seats In England and Wales where the Conservatives and Labour occupied the first two places in 2015 and were separated by less than 10 percentage points. They are shown in the next two graphs, which are divided into four quadrants according to the outcome at each election. The upper right quadrant contains the seats Labour won at both contests; the bottom right contains those it won in 2015 but lost in 2017. The lower left quadrant contains seats won by the Conservatives both times; the upper left those it won in 2015 but lost in 2017.
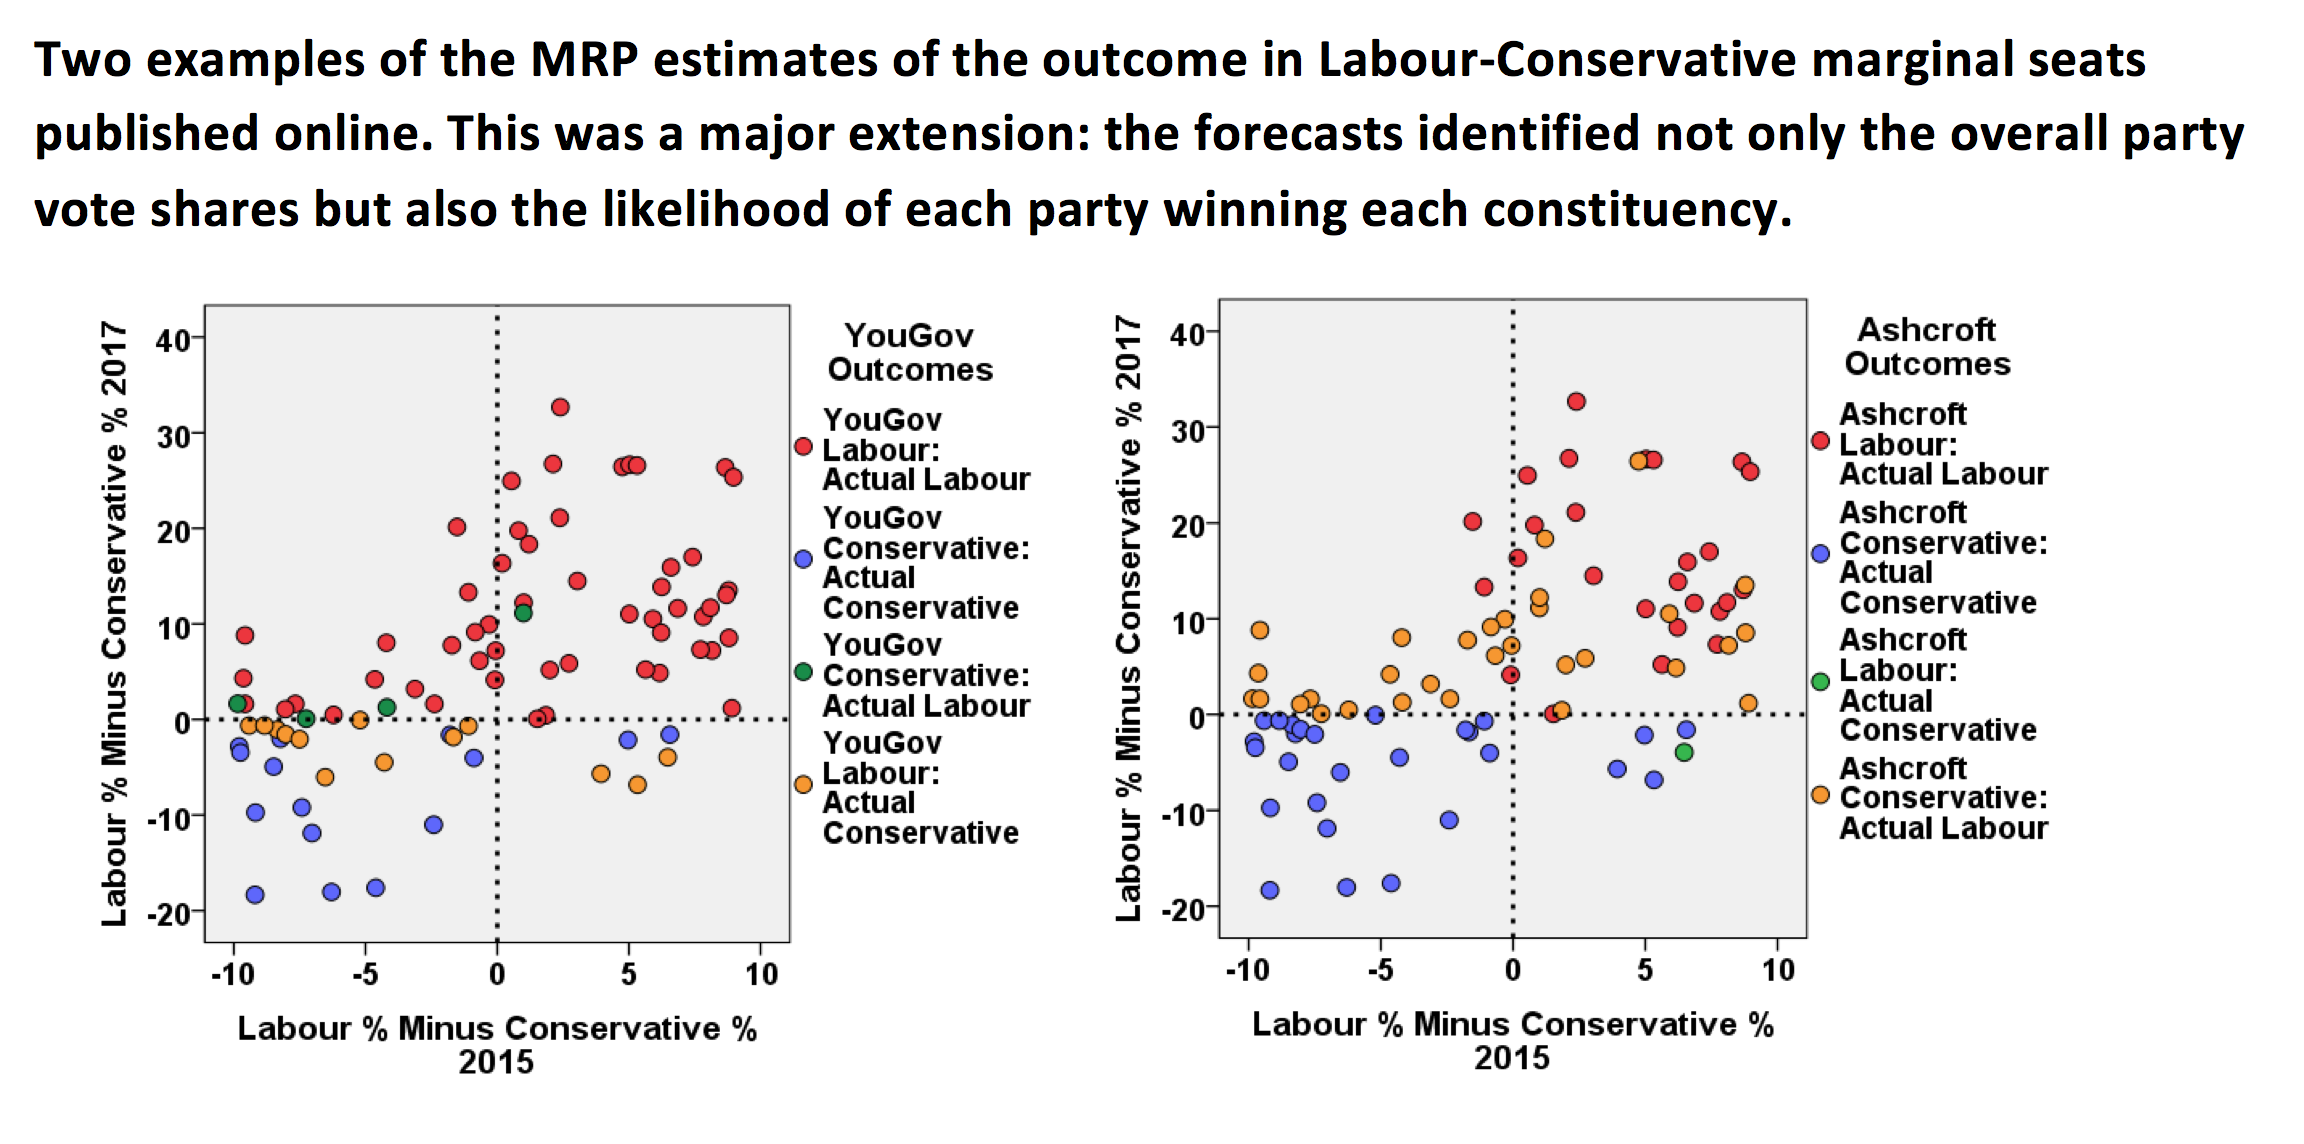
The first graph shows that YouGov correctly predicted the 2017 winning party in 68 seats. It wrongly predicted only one Labour-held constituency as a Conservative rather than a Labour victory, but correctly identified only two of the five seats that Labour lost to the Tories. It also wrongly predicted that ten Conservative-held seats would switch to Labour, and three very narrow Labour wins (shown in green) were wrongly allocated to the Tories. Ashcroft was successful in only 53 of the 85 seats, the second graph showing that 13 seats predicted to be Tory gains were in fact retained by Labour. Hanretty got only 42 right. (The analysts provide more detail, giving the probability of a victory for each party in each seat: these are analysed in the paper on which this article draws.)
In 2017 virtually every Scottish seat was a marginal – the SNP hung on by less than one percentage point in eight constituencies and by between one and five points in a further seven. Predicting the outcome there was fraught with difficulties, therefore, and it showed: all three analysts failed to predict Labour’s six gains, for example, and they over-estimated the SNP’s final tally by between 12 and 16 seats. Of the Conservatives’ twelve gains, YouGov correctly identified seven, Ashcroft five, and Hanretty four.
British general elections are won and lost in the marginal constituencies, and there the analysts’ predictions had a mixed record. In part this reflected the volatility and the many tight contests in Scotland; and in part it reflected the variability of the trends in support both to and against Labour across English and Welsh marginals – in part too undoubtedly reflecting the late surge to Labour in many places that even the last-minute polling failed to pick up completely.
Although there will always be uncertainty about the outcome in very marginal seats, improvements to the modelling procedure – and others yet untried – should see analysts better able to identify where the trajectories of support vary from the national trend and so produce even better estimates of the outcome. Certainly pollsters believe that is the case. A newly created British polling company – Deltapoll – has announced that it will also deploy MRP. By the time of the next general election, it too will undoubtedly be publishing constituency estimates and, given the relative success in 2017, the media and the parties will certainly be paying close attention to what the analysts predict.
A likely consequence of the availability of this additional information is that it will further skew the geography of election campaigning. As parties have become increasingly focused on their target marginal constituencies, so large swathes of the country and very significant segments of the electorate find that they are virtually ignored by the local campaigns. They may get a copy of each candidate’s election leaflet (though large numbers report that they do not), but their support will not be canvassed in any other way, and there may be little public evidence that an election is taking place.
Increasingly activity will concentrate on voters in the marginal seats, especially those where polls suggest shifts in voter preferences that one party will want to capitalise on whilst others seek to reverse them. Voters elsewhere will still be subject to the national campaigning through the media but will be excluded from everything else – not disenfranchisement but disregard. It is unfortunate, therefore, that the recent report on The Politics of Polling from the House of Lords Select Committee on Political Polling and Digital Media (HL Paper 106) did not address this new polling industry development and its likely influence on the conduct of future election campaigns.
Some parties have long campaigned in particular constituencies on the message that ‘only we can defeat party x here’ (party x being the incumbent), but usually without very convincing evidence to sustain their cause: now they can have it, and will want it. Just as internet polling came to dominate election forecasts in the first two decades of the 21st century, constituency estimates will come to the fore in the 2020s. Desirable or not, parties, media and the electorate will have to accommodate them: the tide cannot be turned. And if they become more accurate than in this first exercise, and can accurately predict trends as they emerge, their influence on British democracy will be profound.
This article gives the views of the authors, not the position of Democratic Audit. It was originally published by LSE British Policy and Politics blog. It draws on the authors’ article in the International Journal of Market Research.
About the authors
 Ron Johnston is Professor in the School of Geographical Sciences at the University of Bristol.
 Kelvyn Jones is Professor in the School of Geographical Sciences at the University of Bristol.
 David Manley is Reader in the School of Geographical Sciences at the University of Bristol.
 Charles Pattie is Professor in the Department of Politics at the University of Sheffield.
 Todd Hartman is Lecturer in the Sheffield Methods Institute at the University of Sheffield.
 David Rossiter is an Independent Researcher.
Similar Posts
Subscribe
If you enjoyed this article, subscribe to receive more just like it.


 Democratic Audit's core funding is provided by the Joseph Rowntree Charitable Trust. Additional funding is provided by the London School of Economics.