A tale of two referendums, but similar Remainers: 1975 and 2016
The British public has voted on membership of the EU on two occasions. In 1975, based on a turnout of 64 per cent, two-thirds voted to stay in the EEC, cementing Britain’s place for the next four decades. In 2016, on a turnout of 72 per cent, 52 per cent of the public voted to leave the EU, with 48 per cent supporting Remain. As Ben Clements (University of Leicester) observes, the political and ideological alignments underlying support for withdrawal were markedly different in 1975 and 2016. There were clearer similarities, though, in the socioeconomic correlates of support for remaining.

Piccadilly Circus in 1975, around a month after the referendum. Photo: srv007 via a CC-BY-NC 2.0 licence
The 1975 EEC referendum
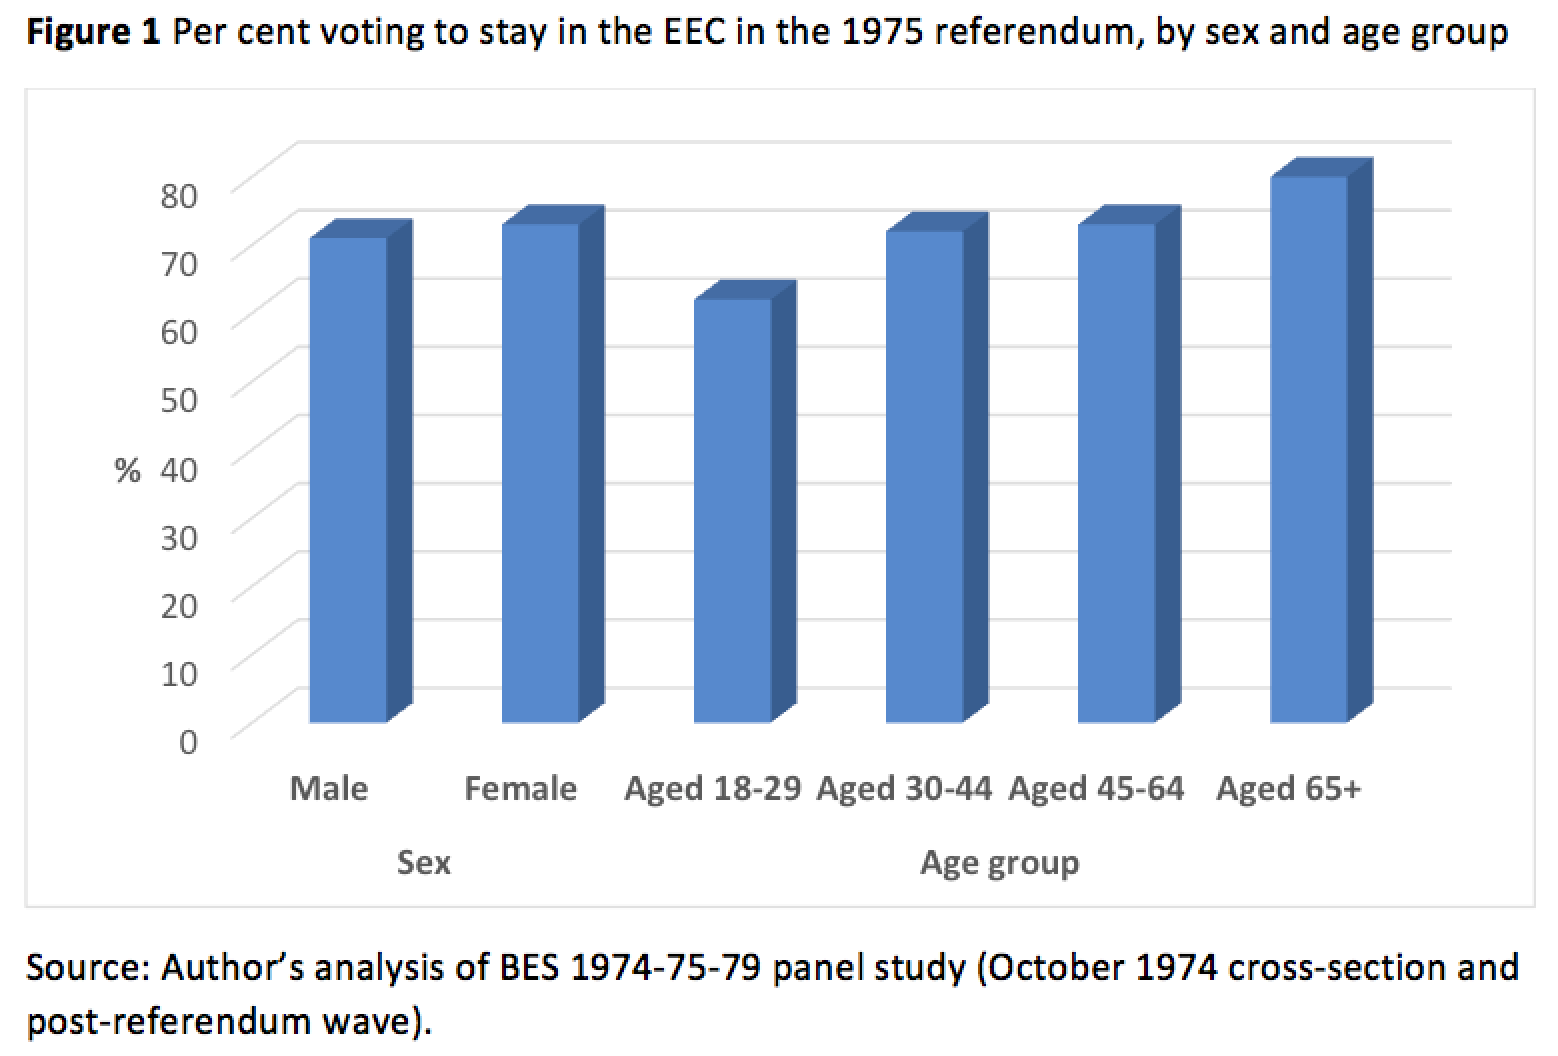
Analysis of data from the BES 1974-75-79 panel study shows how different demographic groups and party supporters voted at the 1975 referendum. The results presented below are generally based on analysis of the October 1974 cross-section and the reinterview of that same sample via a postal survey conducted after the referendum. Based on demographic factors – shown in Figure 1 – 71 per cent of men voted to stay, as did 73 per cent of women. The pattern of voting across age groups showed that support for staying in the EEC was actually higher amongst older age groups: 80 per cent of those aged 65 and older voted in favour of membership, compared to 73 per cent and 72 per cent, respectively, of those aged 45-64 and 30-44; it was lowest at 62 per cent of those aged 18-29.
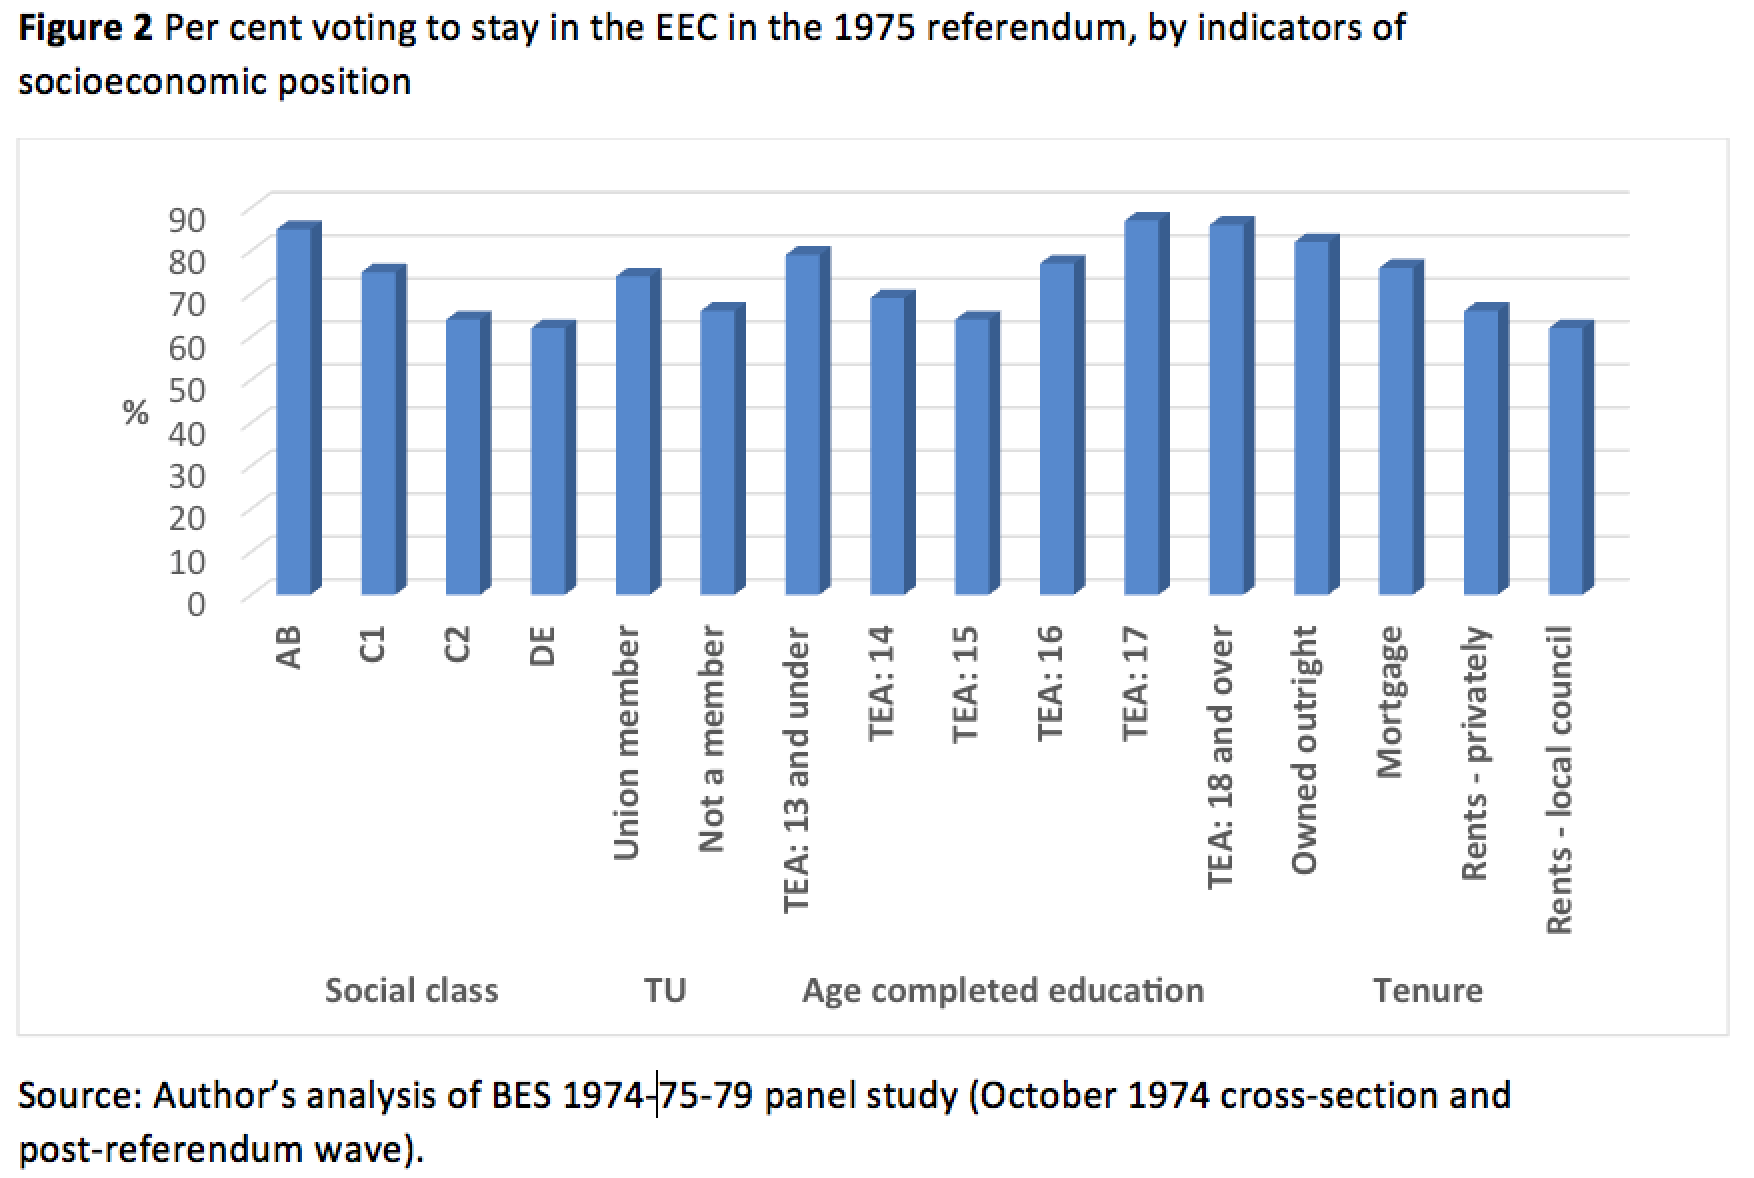
There was a generally consistent pattern, shown in Figure 2, whereby those in more secure socioeconomic circumstances were stronger supporters of membership. Based on social class, those in the AB social grade were most supportive of staying (85 per cent), followed by those in the C1 group (75 per cent), the C2 grade (64 per cent), and was lowest at 62 per cent of those in the DE group. Those in the DE and C2 groups (38 per cent) more than twice as likely to vote to leave as those in the AB group (15 per cent). Voting to stay was somewhat lower amongst union members (66 per cent) than those who were not a member of a union (74 per cent).
Amongst those who finished their education at an older age, support for membership was higher: at 86 per cent of those who completed aged 18 and older and 87 per cent of those who left at aged 17. It was 77 per cent amongst those who left aged 16, and was lowest amongst those who left aged 14 (69 per cent) or aged 15 (64 per cent), but rose to 79 per cent of those who left aged 13 or under. Based on housing tenure, support for membership was highest amongst those who owned their property outright (82 per cent) or who had a mortgage (76 per cent), and lowest amongst those who rented privately (66 per cent) or from a local council (62 per cent).
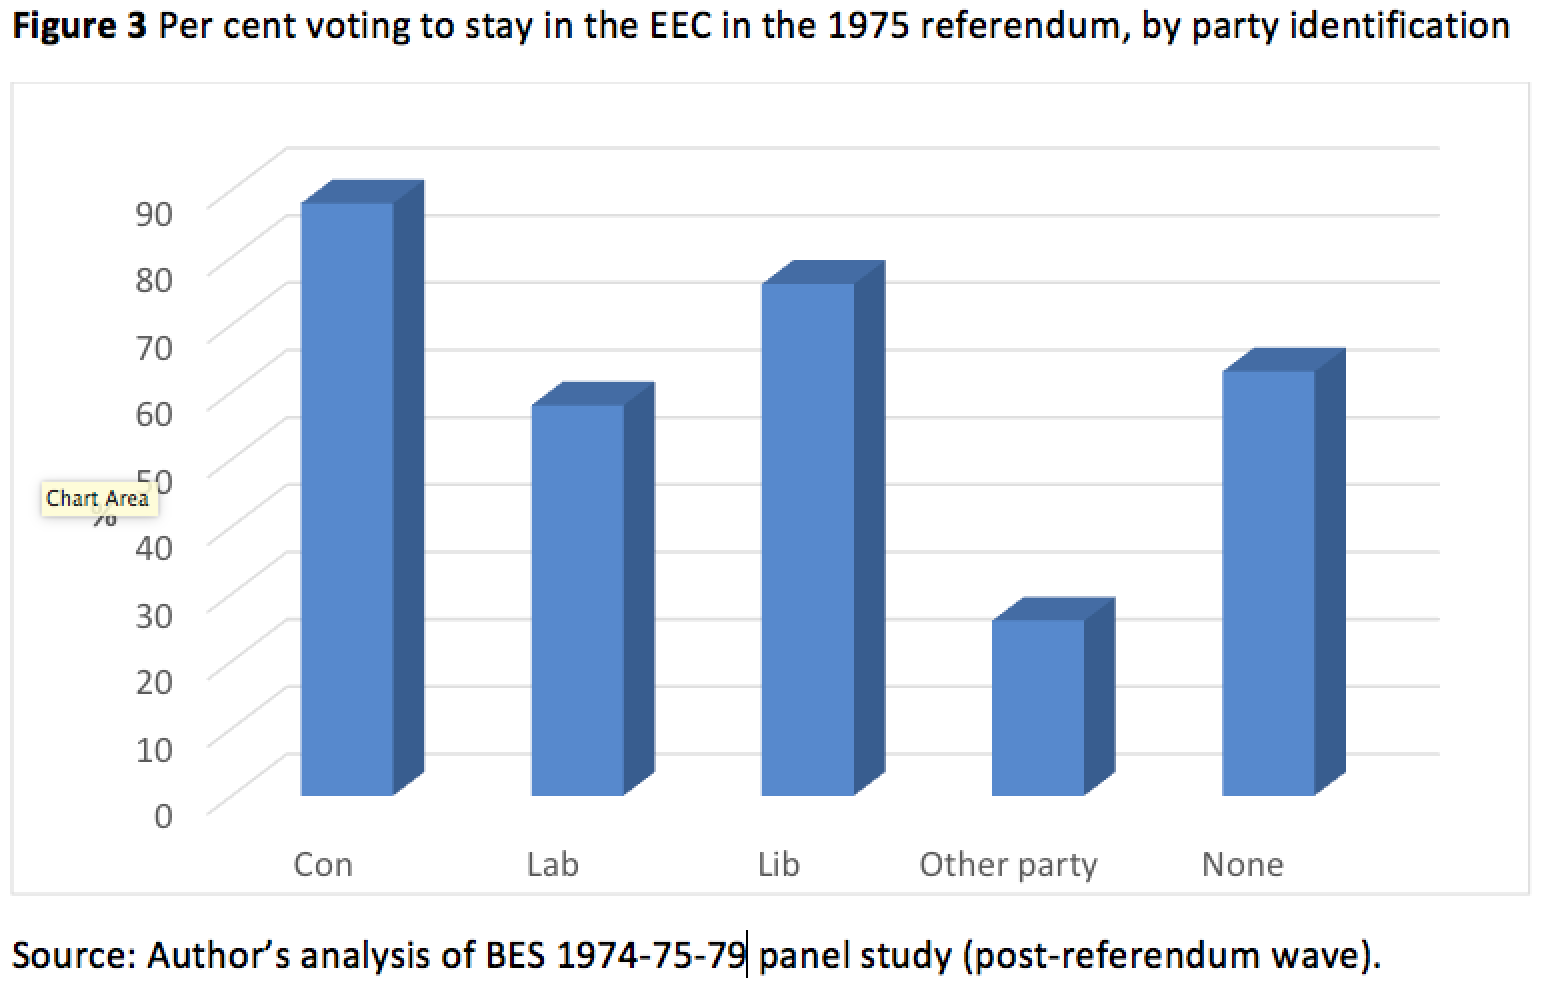
Based on a measure of party identification asked in the postal study after the referendum – see Figure 3 – 88 per cent of Conservative supporters said they voted to stay in the Common Market, as did 76 per cent of Liberal supporters. Support for remaining in the EEC was much lower amongst Labour supporters – although still a majority, at 58 per cent – and just 26 per cent amongst those supporting other parties, such as the Scottish and Welsh nationalists. Amongst those with no party affiliation, 63 per cent supported EEC membership. Labour supporters were more than three times as likely to vote to leave as Conservative supporters and nearly twice as likely as Liberal supporters. The locus of anti-Common market sentiment was centred on the left of British politics in the years leading up the referendum and subsequently. Labour Euroscepticism, as Saunders has noted, was rooted in concerns over the EEC being a capitalist club, that it betrayed Britain’s Commonwealth links, that it was bad for poorer countries, and it took money away from domestic priorities.
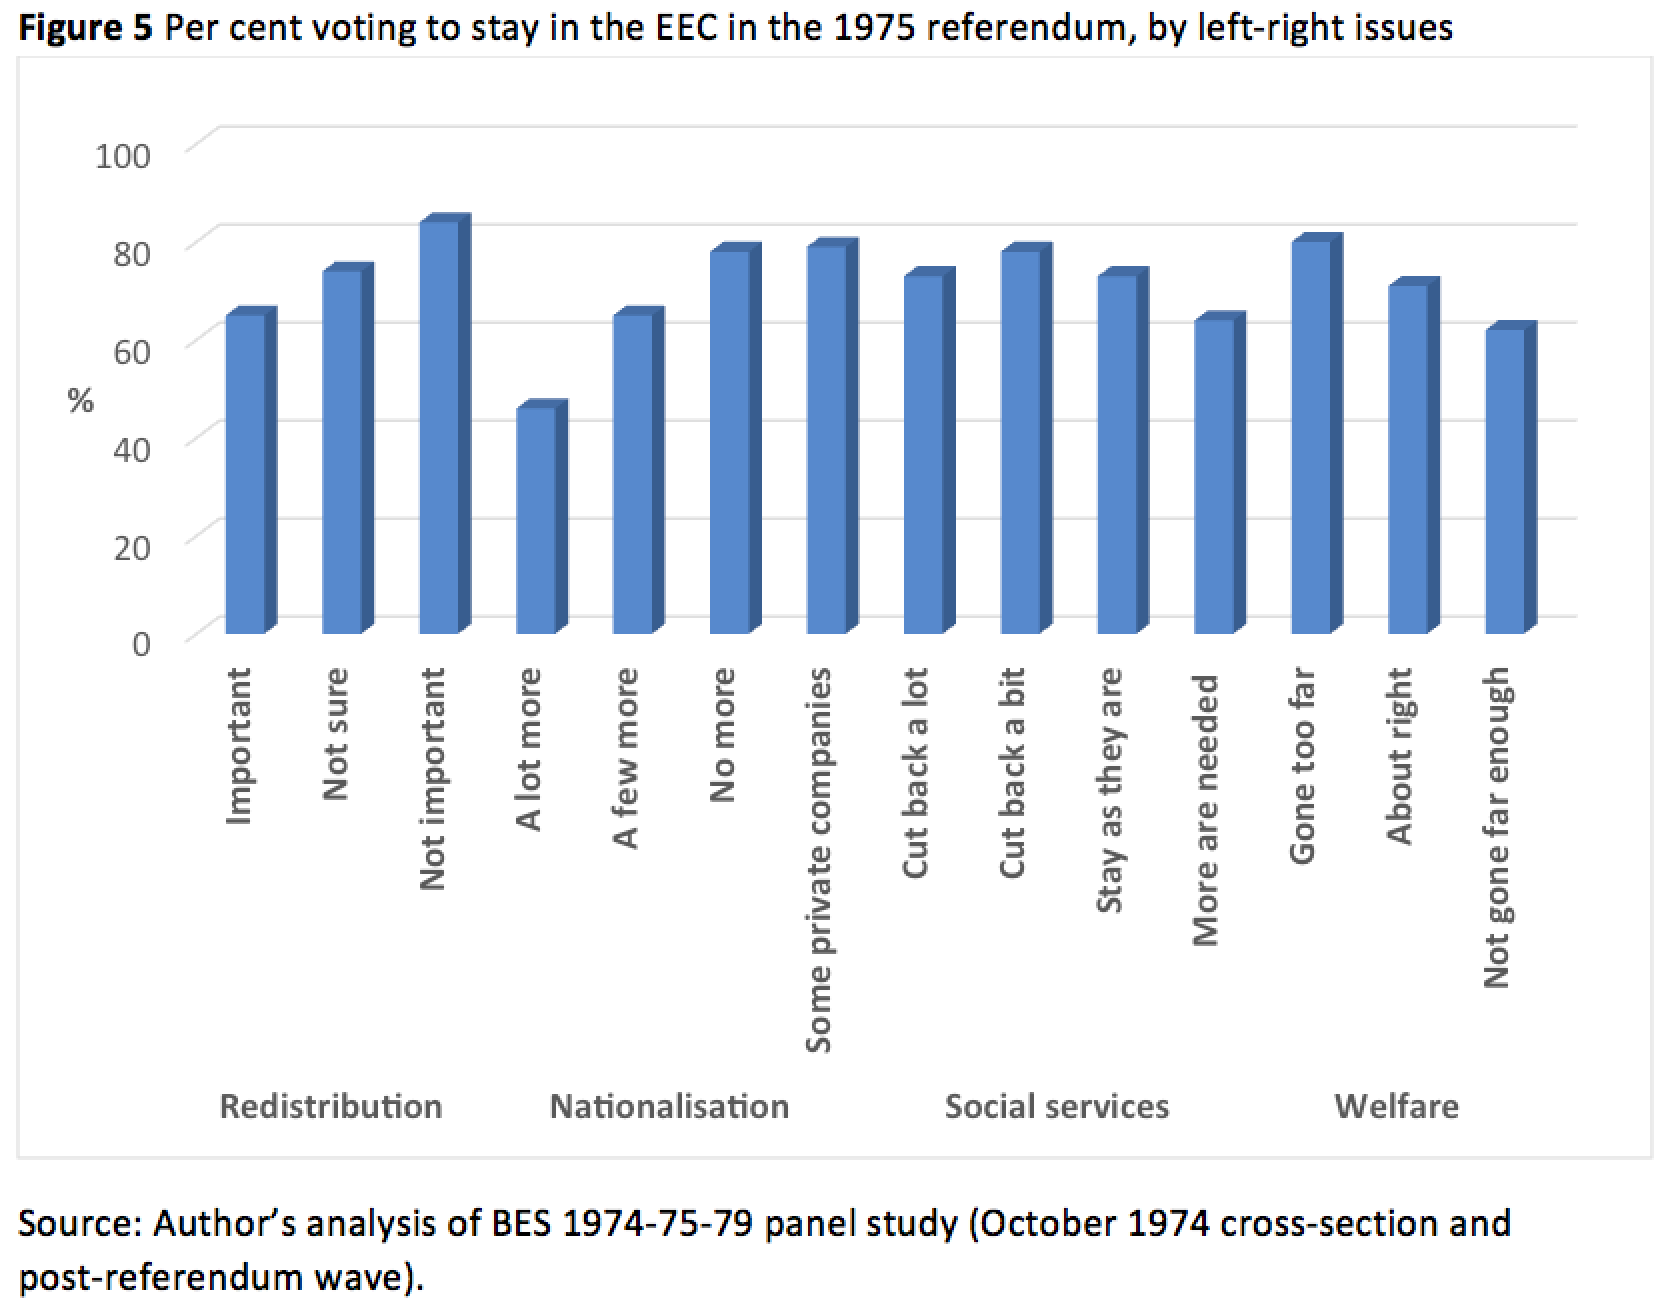
It is clear from the evidence presented in Figure 4 that in terms of policy debates central to the left-right axis of British politics – such as nationalisation, redistribution, the role of the trade unions, and the provision of welfare and services – those favouring left-wing solutions were less likely to have supported staying in. On the nationalisation-privatisation issue, those who backed a lot more (46 per cent) or a few more companies (65 per cent) being taken into state ownership were less fulsome in their backing for remaining than were those who favoured no further nationalisation (78 per cent) or who preferred more private companies (79 per cent). Amongst those who thought that government redistribution of wealth was very or fairly important, 65 per cent voted to stay, lower than the 74 per cent support for membership amongst those who were unsure on this issue and the 84 per cent support for membership amongst those who said redistribution was not important.
Pro-remain voting was also higher amongst those who supported social services being cut back a lot (73 per cent) or a bit (78 per cent), or who said they should stay as they are (73 per cent), compared to those who said more were needed (64 per cent). On welfare benefits, those who thought things had gone too far were more likely to have voted to remain in the Common Market (80 per cent), compared to 71 per cent of those who said things were about right and 62 per cent of those who said things had not gone far enough.
Left-wing opposition to the EEC was clearly evident in both party affiliations and in ideological leanings.
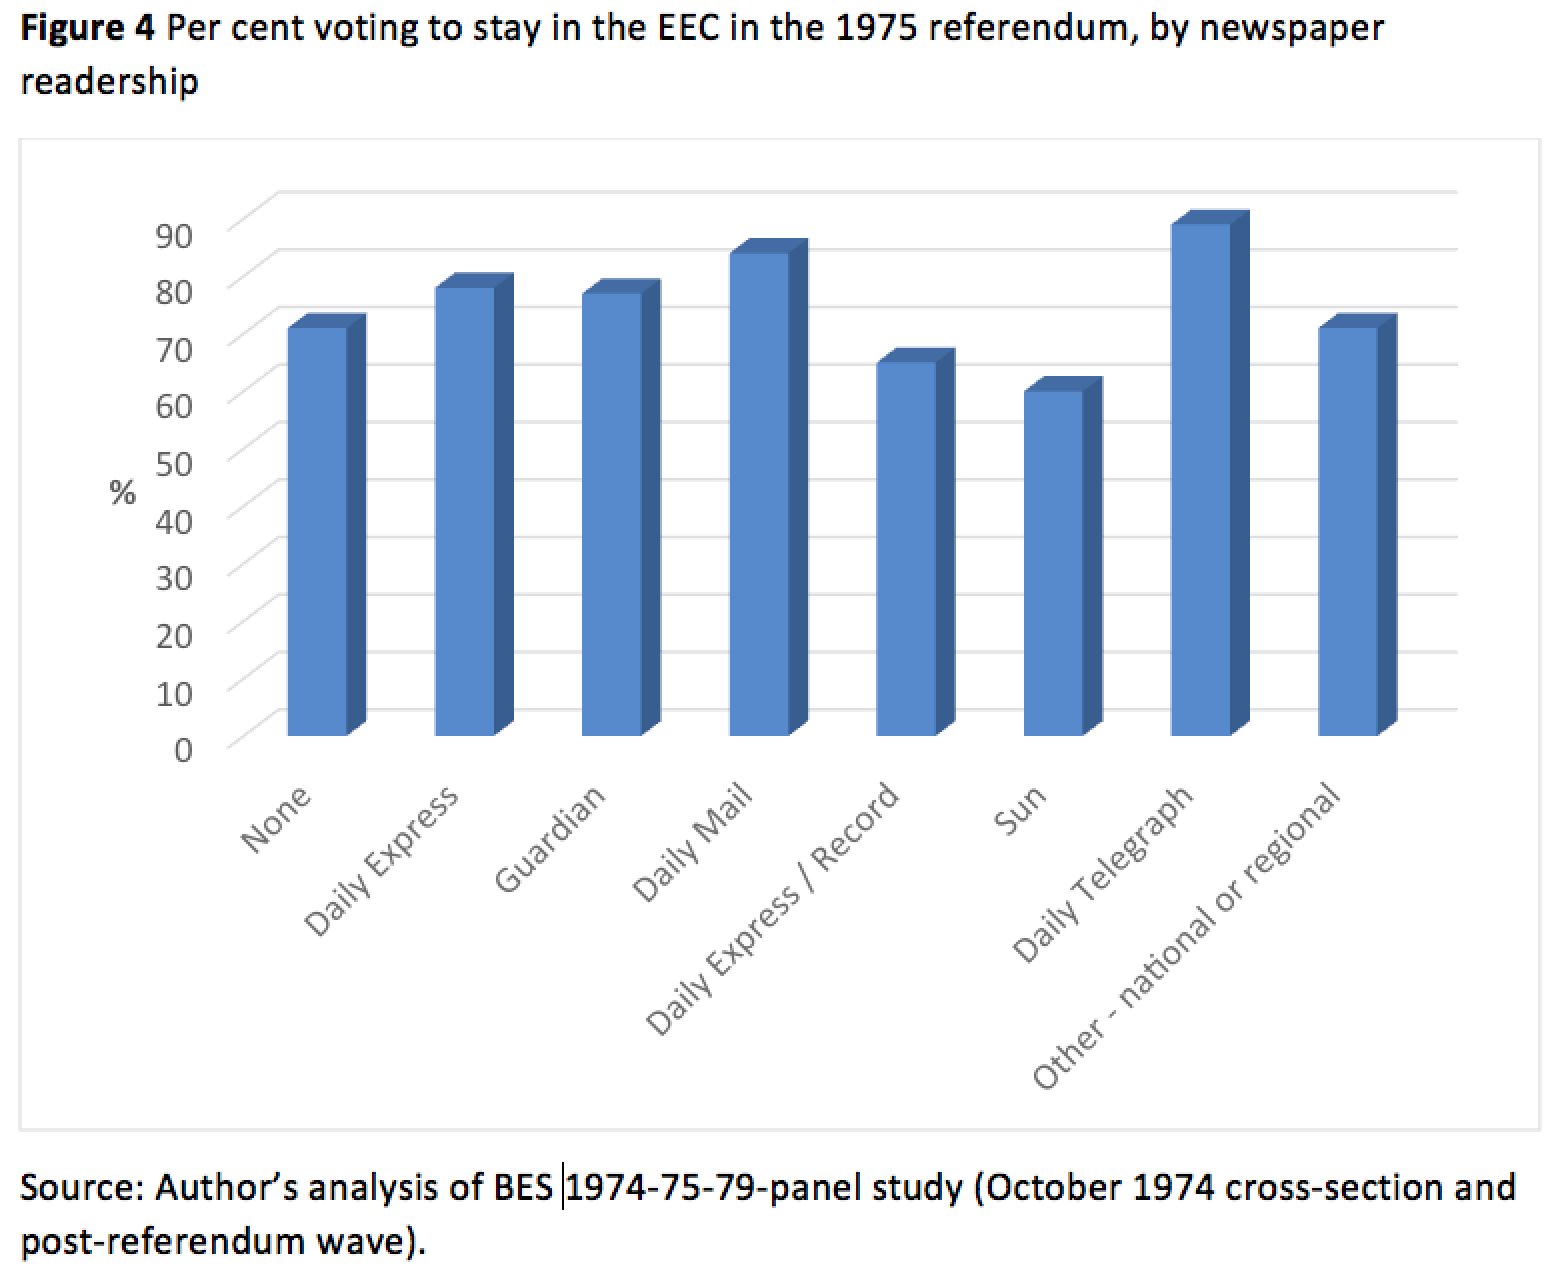
Based on newspaper readership, displayed in Figure 5, support for EEC membership was lowest amongst those who read the Sun (60 per cent) or the Mirror / Record (65 per cent) and stood at 71 per cent of those who read some other newspaper or did not read one. Support for membership was higher amongst readers of the Daily Express (78 per cent), Guardian (77 per cent), Daily Mail (89 per cent), and the Daily Telegraph (89 per cent). All of these papers had actually supported Britain staying in the EEC; only the Morning Star was opposed.
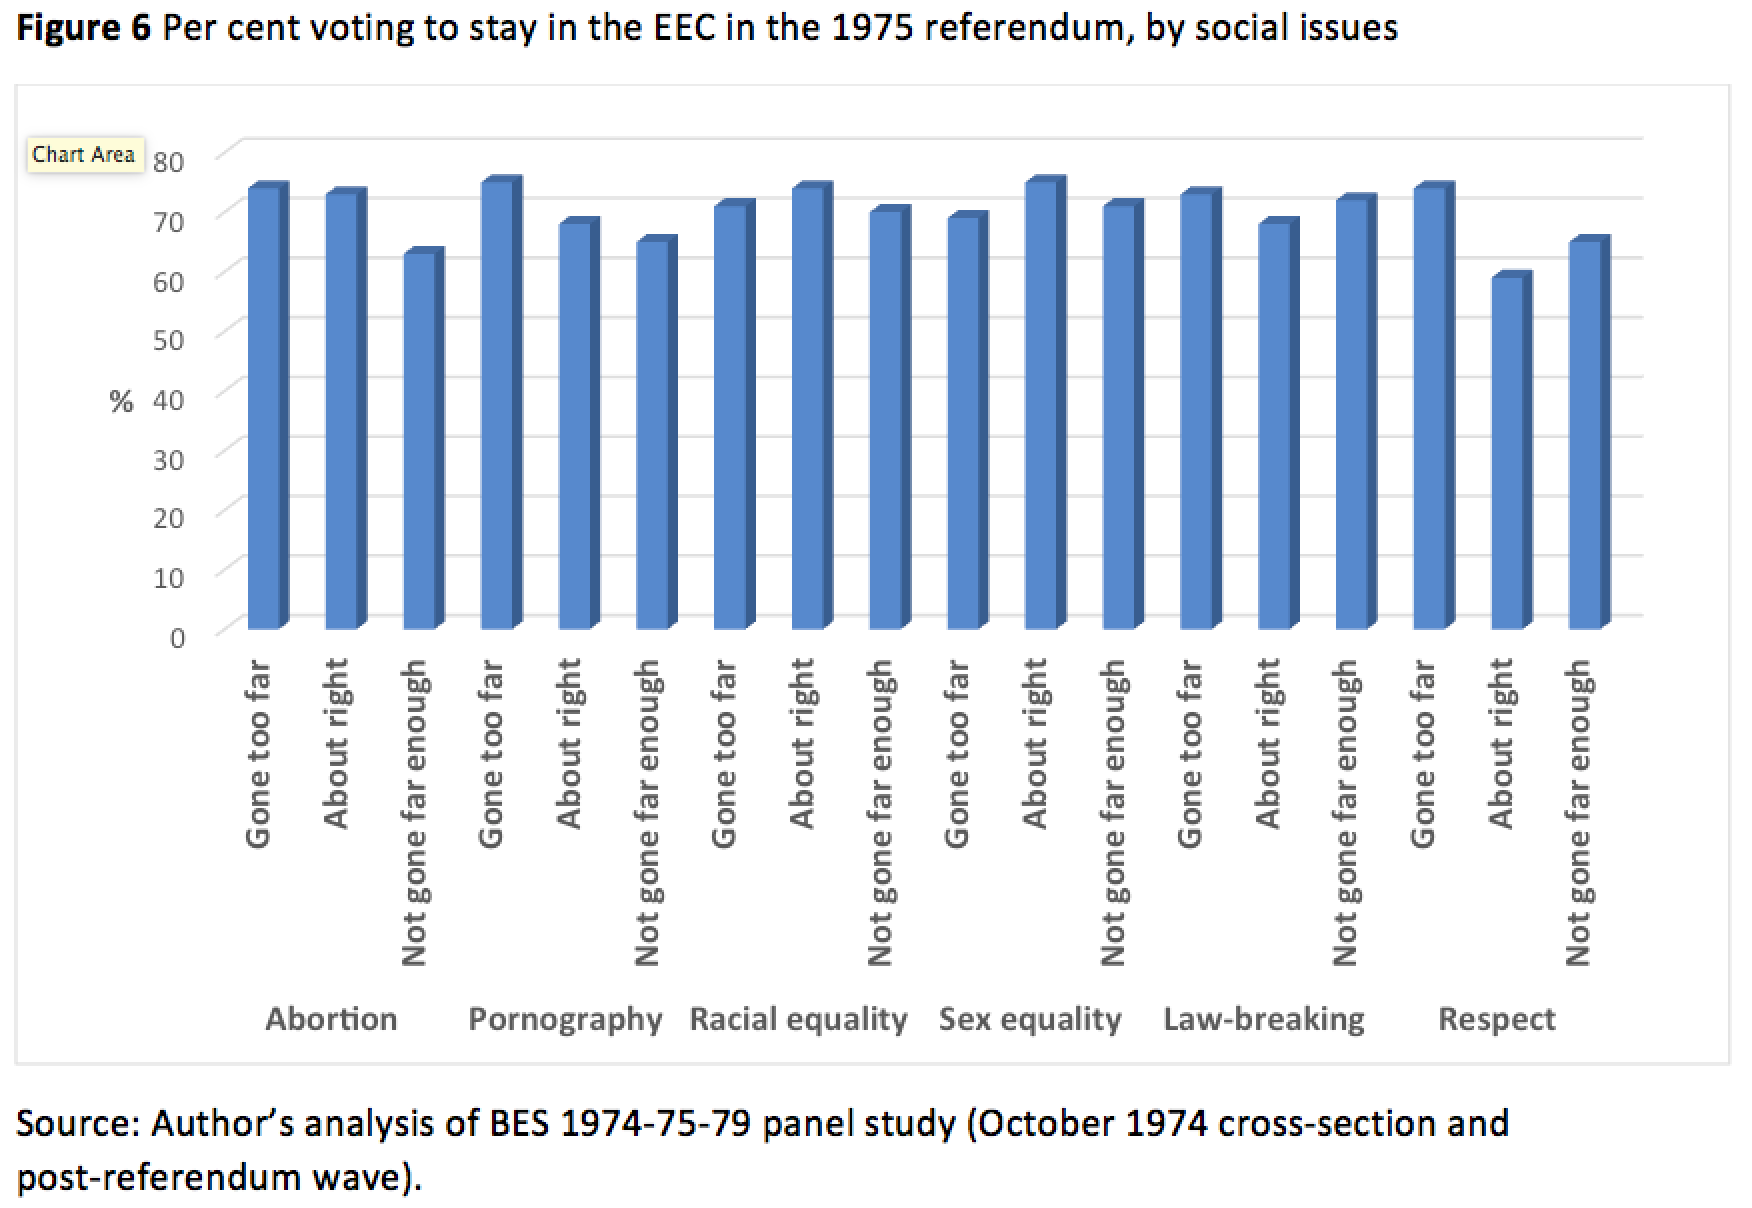
Looking at voting based on social or moral issues – asking whether particular societal behaviours or attitudes had gone too far, were about right or had not gone far enough – there is no consistent pattern, and the differences were generally of a smaller magnitude than for left-right issues. As is shown in Figure 6, those who said that pornography or respect had gone too far or were about right same were somewhat more likely to have voted in favour of membership, as were those who said abortion had gone too far. There was less or little variation based on views towards sex equality, racial equality, and law-breaking. Based on views towards immigration – specifically, whether it was important or not for the government to repatriate immigrants – support for membership stood at 68 per cent of those for whom this was important, 73 per cent amongst those who were not sure and 74 per cent of those who said it was not important.
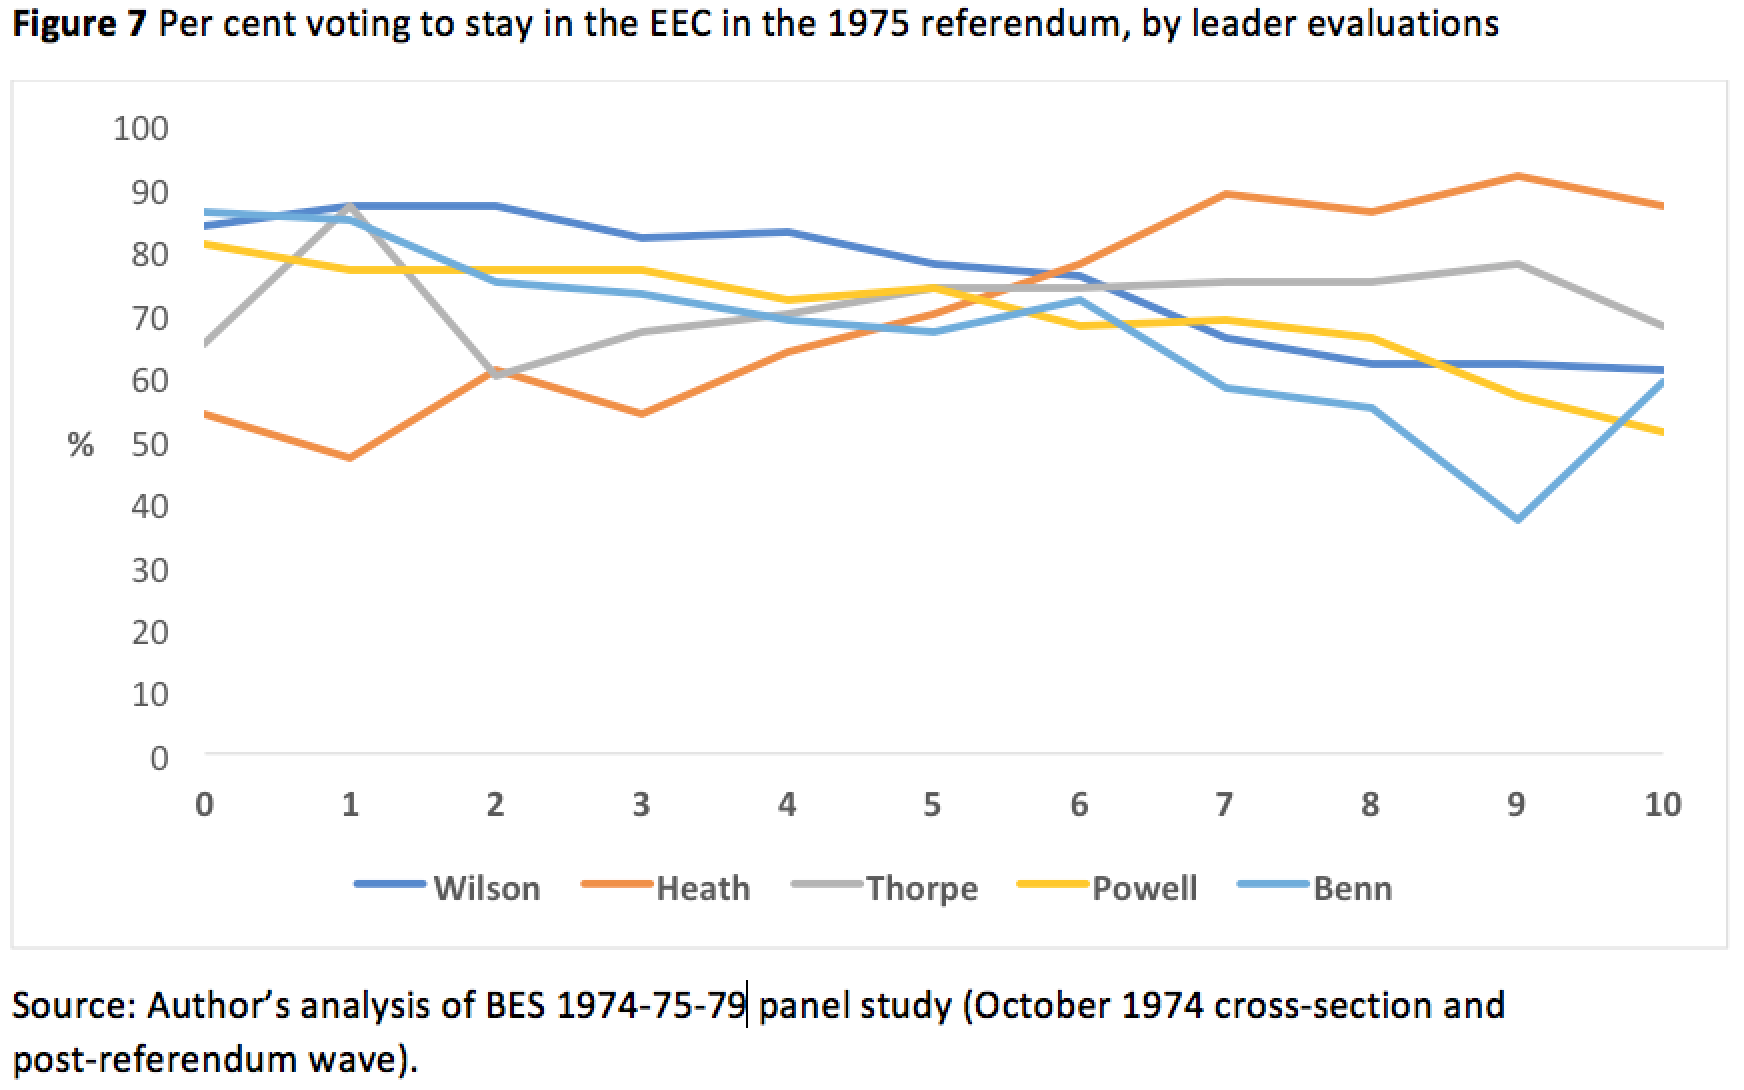
Finally, we can assess voting in the 1975 referendum based on evaluations of leading party-political figures of the day, where respondents were asked to rate them on a scale ranging from 0 to 10. For each increment on the scale per leader evaluation, the proportion that voted to stay in the EEC is shown in Figure 7. Voting to remain in the EEC was generally lower amongst those with very negative ratings of Heath and amongst those with the most positive appraisals of Benn, Powell, and Wilson. Voting to remain tended to be highest amongst those with the most positive views of Heath and the most negative views of Wilson and Benn.
Overall, opposition to EEC membership was disproportionately found amongst those in the lower social grades, those who completed education at an earlier age (with the obvious exception of those leaving at aged 13 or under), trade union members, those living in Scotland (58 per cent supported membership in this survey), younger people, readers of The Sun and the Daily Mirror, Labour party supporters, and those with left-wing policy preferences.
Comparing voting at the 1975 and 2016 referendums
For the 2016 EU referendum, detailed results for group voting were provided in a NatCen report published in December 2016, and the findings discussed below are taken from this report. Voting to remain in the EU was somewhat higher amongst women than men and was much more prevalent amongst younger people in 2016, reflecting generational differences in Euroscepticism. This was not the case in 1975. There was a huge differential based on educational attainment: those with a degree-level qualification were least likely to have voted to withdraw; those with no qualifications were most likely to have voted to leave. Pro-leave voting was higher amongst those in lower income groups and amongst those renting their homes in the public sector. The less well-off and economically insecure were more likely to have voted against the EEC and, four decades hence, the EU.
However, the voting patterns in 2016 based on political factors show some important differences from those that prevailed in 1975, reflecting the fact that the locus of Euroscepticism in recent decades has been on the right of British politics. In terms of party support, voting to leave was strongest amongst backers of parties on the right: 98 per cent of UKIP supporters voted to leave and 58 per cent of Conservative supporters did the same (as did 70 per cent of those with no allegiance). Labour was seriously divided on the issue in 1975, with senior ministerial figures campaigning for and against the EEC, and Labour voters not being given clear or consistent party cues. In 2016, this was the situation in which the governing Conservative Party and its supporters found themselves. In 2016, just 36 per cent of Labour supporters voted to leave, as did 26 per cent of Liberal Democrat supporters, 21 per cent of Green Party supporters, and 26 per cent of those favouring other minor parties (including the SNP and Plaid).
Amongst newspaper readers, support for leave in 2016 was highest amongst those who read right-leaning tabloids – the Sun, Express, Mail, and Star – and then Telegraph readers. It was lower amongst those who read no paper or some other paper and Mirror readers; and lowest amongst readers of some of the broadsheets (Times, Guardian, Independent and Financial Times). In 1975, readers of the Telegraph, Express and Mail were strong backers of EEC membership.
Ideologically, in 2016, there was little difference the leave vote across those categorised as right, left, or in the centre, but it was much more common amongst those with an authoritarian orientation compared to those who were libertarian or neither. It was also much more prevalent amongst those with an anti-welfare disposition compared to those who were pro-welfare or neutral.
Conclusion
Comparing the patterns of voting, support for membership in both popular votes was concentrated amongst those with higher socioeconomic status. In 1975, pro-leave voting was more common amongst those in younger age groups; the opposite was the case in 2016. In 1975, those in living Scotland, Labour party supporters, and those of a left-wing disposition were strong components of the anti-Common Market vote, as were readers of the Daily Mirror. In 2016, the forces of the political right – whether based on party support for UKIP or the Conservatives, or anti-welfare and social authoritarian ideological dispositions, or newspaper readership – were pivotal to the decision to leave.
This article gives the views of the author, and not those of Democratic Audit. It first appeared at the LSE Brexit blog.
 Ben Clements is Associate Professor at the School of History, Politics and International Relations, University of Leicester. He has had two books recently published by Palgrave Macmillan: Religion and Public Opinion in Britain: Continuity and Change and Surveying Christian Beliefs and Religious Debates in Post-War Britain.
Similar Posts
Subscribe
If you enjoyed this article, subscribe to receive more just like it.


 Democratic Audit's core funding is provided by the Joseph Rowntree Charitable Trust. Additional funding is provided by the London School of Economics.
A very useful piece linking the two referenda together – it’s something that barely anyone has done, even journalistically – every time you try to compare and contrast you usually have to look at all different sources or superficial articles. Thanks for it.
There is so much interesting info collected here, but one thing is the contrast in the attitude of the young between 1975 and 2016. It is a reminder of the danger for Remainers of making assumptions about the young being captive supporters of the EU. For a very long time, until only a few years before the 2016 vote, 18-25 voters in the UK were among the most eurosceptic (yougov polling shows this clearly https://www.opendemocracy.net/uk/damian-hockney/dont-make-crude-assumptions-about-young-peoples-attitudes-to-eu ) , and if you look at the extraordinary data collected across the EU by organisations like the Friedrich Ebert Foundation, you will see that in many countries (France, Hungary, Greece, for example), it is the young who are by far the most anti-EU. And the old who are most pro. And the difference is stark.
When young people and commentators therefore suggest that in the UK it is not fair or indeed ‘selfish’ of older voters to decide their future, the same argument can be turned awkwardly in its head in many European countries: “why should a 70 year old in Paris fearful of past conflict decide my future as a 19 year old in the city who believes France would be better off out?”