Local authorities continue to keep citizens in the dark about council elections and their results and outcomes
Local elections in England took place in May, but the outcome of those elections is in many cases difficult to ascertain, particularly with regard to the make-up of the administration governing ‘No Overall Control’ authorities. Here, Chris Game laments this, and argues that is unacceptable for local authorities to continue keeping citizens in the dark when it comes to local democracy.

Rochdale Town Hall (Credit: Aero Pixels, CC BY SA 2.0)
This blog, definitely my last on this year’s local elections, is late, but largely because its focus necessitated waiting for several councils’ Annual Meetings, the season for which only recently ended. That in itself is frustrating, but it’s not the moan in the title. The titular moan is one I’ve made before, in these columns and elsewhere, but to no noticeable effect, so I’m now trying to improve its chances by putting it up front and incorporating some potentially more influential moaners.
In fact, it’s a two-part moan, the general part being the extent to which far too many councils still keep their own voters and citizens – let alone curious outsider weirdos like me – under-informed about one of the uniquely defining features of our local democracy (the key’s in the noun): council elections, their results and outcomes.
Local Government Chronicle editor, Nick Golding, made the same point following the 2014 elections, noting that, in their extensive failure to treat these pivotal events as the “big deal” that they are, councils were actually hampering their own legitimacy:
“If councils cannot show an interest in their own elections, it is hard to see why their residents should.
“It might be considered disappointing that some newspapers buried their coverage or failed to work out how individual results could change the political complexion of an authority … What was incomprehensible was the failure of many authorities to highlight their polls. Many council homepages made no reference to the elections and hid elections news in obscure corners; many seemed incapable of promptly posting the results for each ward or revealing how their chamber’s political make-up was changing as a result”. (my emphasis)
My added emphasis signposts the second and specific part of my moan: that so many councils seem unable to grasp the difference between results and outcomes and the distinctive importance of both. The presentation of basic ward results is often shoddy enough – based apparently on the assumption that the only viewer is a local voter interested solely in the name and label of the winning candidate in their own ward; not in whether that individual result represented a gain or a hold, or whether the incumbent was even standing, let alone what it contributed to the overall control of the council – this latter, of course, constituting the outcome.
LGC’s crusading baton was picked up this year by the Local Government Information Unit (LGiU), whose whole coverage of the elections was exceptionally enterprising – including a pre-elections guide, a live results service through an ‘Out for the Count’ project in conjunction with Democracy Club and the Open Data Institute, and ‘before and after’ interactive maps – as shown on the right below.

I’ll come to them shortly, after hearing first from LGiU chief executive, Jonathan Carr-West, who, in a recent article for The MJ, reiterated how the quality of councils’ information about local election results is, as he far too respectfully put it, “still somewhat less than optimal”.
“There are some brilliant councils who make their results accessible, but in too many cases finding out who controls a council and how it has changed as the result of the election requires digging and analysis.
“Basic test: does your council state clearly and obviously on its website what the political control of the authority is?” (my emphasis)
It’s so utterly basic that it’s almost embarrassing to have to mention, but my personal guess is that for at least three-quarters of the 124 councils holding elections this year the answer is No – not clearly and obviously, and for a very large fraction not at all.
My confidence in this dispiriting assertion is that I’ve tested it out – with the two dozen councils (one in five) that have least excuse for failing the Carr-West test: those that were left after May 5th describing themselves as NOC – under No Overall Control – and, as far as compilers of election statistics are concerned (as opposed to specialist bloggers like David Boothroyd), that’s how they’ll remain for at least the next 11 months, as in the above BBC table, or indeed the grey holes in the LGiU map.
NOC – it’s widely used in local government, reasonably widely understood, and seems, therefore, to serve a useful purpose. But there must surely be some outside the proverbial loop who confuse ‘No Overall’ with ‘Out of’, and conjure up images of packs of newly elected, feral councillors roaming their neighbourhoods wreaking unspeakable havoc for who knows how long.
More seriously, it’s fundamentally misleading. In signifying only that no single party has a majority of council seats, it gives no hint that a perfectly conventional ruling administration will be formed, probably within days and almost certainly by the conclusion of the Annual Council Meeting. This information, including the date, location, and function of the ACM, should be conveyed “clearly and obviously” to the public – preferably, I’d have thought, as a website home page news item – at the same time as posting headlines of the election results. And, equally obviously (in both senses), followed up by an announcement of the outcome – the political control of the council for the foreseeable future – as soon as the temporary NOC has been resolved.
NOC is misleading in a second sense too. In excluding from those all-important lists of councils gained and lost the nearly one-fifth in which a party has the largest, but minority, share of councillors, it distorts the parties’ true performances – this year to the detriment of the Conservatives, whose councils ‘won’ would increase from 38 to 53, compared to Labour’s proportionately much more modest increase from 58 to 66.
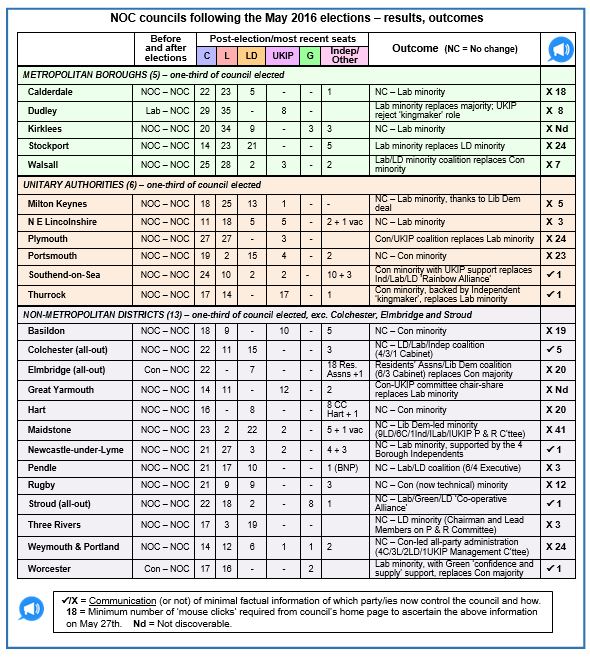
Anyway, the informational purpose of this blog is to identify the actual outcomes of this year’s crop of NOCs, with the secondary purpose being to indicate how easy or difficult that deceptively simple task proved for someone reasonably familiar with council websites. Just as the political deliberations sometimes extended over weeks, so has my information gathering, and, if any mistakes have crept into my less than copybook notes, I naturally apologise.
In one sense, the task is indisputably hours easier than it would have been in times past – for the simple reason that this year’s 24/124 (19%), broadly reflecting the current overall English total of 52/351 (15%) (p.17), is way below the close to 30% average over the past three decades (p.6). It may seem counter-intuitive, but the effect of up to a third of us casting our local votes nowadays for other than the three main parties (21% this year, 32% in 2013 – p.16) has been to increase substantially the proportion of councils majority-controlled by at least the big two and to reduce correspondingly the proportion of NOCs.
The second change, certainly over the past decade or so, has been councillors’ approach to the resolution of NOC – or, put another way, to the governance of so-called hung councils. When the committee system gave way to executive-based decision-making following the Local Government Act 2000, two- or multi-party power-shares comfortably outnumbered single-party minority administrations. Prompted in part, obviously, but not exclusively by the allowances system, that balance has completely reversed, as we’ve seen again this year: 16 single-party minority administrations to 8 coalitions/alliances.
It’s not this blog’s purpose to detail, even where they’ve been made public, the negotiations behind some of the less predictable or more exotic arrangements. But it is worth noting that, however much coalition theorists might wish otherwise, it’s fruitless attempting to hypothesise outcomes from arithmetic without at least some knowledge of the respective local parties, their leaderships, and recent history.
Would the Lib Dems in Walsall, in coalition with the Conservatives less than two years ago, really act so true to alleged type and join up with Labour? Or would they be apparently more principled, as in Calderdale, where, as noted in my elections preview, the two parties had combined in the no confidence vote ending an earlier spell of Labour minority control, but the Lib Dems subsequently refrained from backing from either major party? As you’ll see in the table, yes and yes. Then there’s UKIP, whose mating instincts are evidently aroused by the sea air – prepared to deal in Southend, Great Yarmouth, Plymouth, and Weymouth & Portland, but not in Dudley.
The loud hailer column on the right of the table is supposed to signify communication, and to record, starting from the homepage of each council’s website, the minimum number of mouse clicks it took to get to the summarised answer to the Carr-West basic test: who politically controls this council? If I’d anticipated quite how painful it would sometimes prove, I might well have stopped with the simple answer: that in two-thirds of these cases, where the future control of the council couldn’t have been announced with the election results, even had there been the inclination, no one subsequently apparently thought it significant enough to bother. I don’t mean just as a news item, but ANYWHERE – under Election Results, How the Council Works, Councillors and Committees, ANYWHERE.
Given that depressing overall picture, the detailed click numbers aren’t that important – except perhaps to highlight the exceptional councils that do appear to get the point. I will conclude, though, by adding the few rules I set myself, partly in case there are councils who may feel in some way misrepresented, and partly for the benefit of anyone out there sad or made enough to want to replicate the exercise.
- I started by looking for the announcement as a news item, either on the home page, or checking back to May 6th – but, if there was no announcement, those clicks weren’t counted.
- Then to and through whatever link(s) looked most promising – About the Council, Local Democracy, Councillors & Committees, etc. – but again not counting any dead ends.
- Then, for those apparently treating council control itself as an official secret, to the Cabinet, Executive, P & R Committee, or whatever, that looked likely to let the cat out of the bag. The moderately shameful click numbers usually represent member lists with party affiliations attached, the utterly shameful ones where this classified information is only obtainable one councillor at a time.
And we wonder why only 31% of the electorate bother to turn out in these local elections – or do we?
—
Note: A version of this post also appears on the PSA blog. It represents the views of the author and not those of Democratic Audit or the LSE. Please read ourcomments policy before posting.
—
 Chris Game is an Honorary Senior Lecturer at the Institute of Local Government Studies (INLOGOV), University of Birmingham. His interest are in politics of local government; local elections, electoral reform and other electoral behaviour; party politics; political leadership and management; member-officer relations; central-local relations; use of consumer and opinion research in local government; the modernisation agenda and the implementation of executive local government.
Similar Posts
Subscribe
If you enjoyed this article, subscribe to receive more just like it.


 Democratic Audit's core funding is provided by the Joseph Rowntree Charitable Trust. Additional funding is provided by the London School of Economics.
RT @electoralreform: “Local authorities continue to keep citizens in the dark about council elections and their results and outcomes” https…
I would like to call out Flintshire council in North Wales who, six weeks since the Assembly elections, have STILL not put the regional election results for the North Wales electoral region (for which they were the regional counting council for) by constituency on their website
Local authorities continue to keep citizens in the dark about council elections and their results and outcomes https://t.co/pa1bYgBBFO
Superb article about local elections and how #localgov could be better at sharing with residents:Democratic Audit UK https://t.co/K2dKfRyCsx
Local authorities continue to keep citizens in the dark about council elections and their results and outcomes https://t.co/oANNl35uG3
Chris Game @INLOGOV rebukes LAs: “And we wonder why only 31% of electorate bother to turn out in local elections”
https://t.co/nUccJZ8c90
Local authorities continue to keep citizens in the dark about council elections results https://t.co/Fv2OFs6jpQ | Chris Game | #opendata
Local authorities continue to keep citizens in the dark about council elections and their… https://t.co/ibVwbIEDeO https://t.co/fRBIGgrOCv