New analysis reveals what types of organisation give evidence to parliamentary select committees
Parliamentary select committees are one of the most important sources of external input into the policy-making process. Committees call witnesses to their hearings, whether to hold them to account or to make use of their expertise in a particular field. Democratic Audit has been conducting research into the composition of these witnesses: in this first post, Richard Berry shares findings on the organisational affiliations of those giving evidence.
Trade associations like the Federation of Small Businesses appear often at select committees. Credit: DUP, CC BY-NC-ND 2.0
Select committees are becoming increasingly significant in British politics. Aided by the Wright reforms from 2010 onwards, they have grown in visibility, influence, reach, and workload. These changes included open elections for the membership, and crucially chairs, of committees, where these positions had previously been in the gift of party whips. Research from Democratic Audit’s co-Director, Professor Patrick Dunleavy has shown that committees are now cited by the media a great deal more, with some in particular (such as the Home Affairs committee) more than doubling their coverage since the reforms were implemented.
We wanted to find out more about which people are invited to appear before committees as witnesses. Many of these are government ministers or senior officials, whom committees hold to account for policy and performance. A greater number are from outside government, including stakeholders and experts in topics a committee has decided to investigate. In the second part of our analysis, we will consider the gender balance of witnesses. Here, we look at organisational affiliations.
Our findings come from a snapshot of committee activity. We compiled a database of all witnesses appearing at a select committee (including in the Commons, Lords and joint committees) from 8th October to 7th November 2013. In total, we examined 167 committee sessions, featuring 583 witnesses. The full dataset will be available to download from Democratic Audit tomorrow.
Sectors
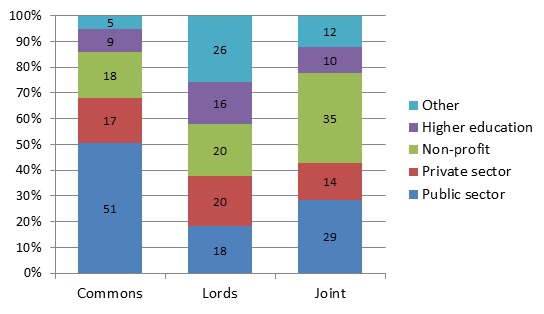
First, we considered the sectors witnesses were drawn from. Unsurprisingly, the public sector was the biggest source across committees as a whole, providing 41% of witnesses, compared to 18% and 20% for the private and non-profit sectors respectively. However, this was largely due to House Commons select committees, most of which focus on specific government departments – Lords and joint committees had a more even spread of witnesses from different sectors:
Figure One: Select committee witnesses by industrial sector (%)
The private sector witnesses were evenly split between individual companies (58%) and trade associations (42%). A large majority of public sector witnesses (see Figure Two) were from central government departments, agencies and commissions (including ministers), with a fifth from other public organisations. There was more variety among witnesses from the non-profit sector, as shown in Figure Three.
Figure Two: Organisation type of select committee witnesses from public sector (%)
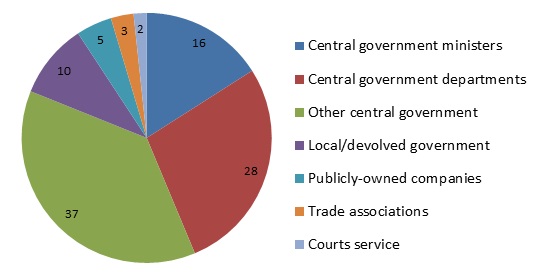
Figure Three: Organisation type of select committee witnesses from non-profit sector (%)
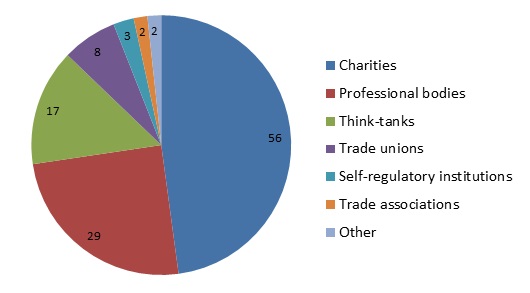
Note: ‘Charities’ refers to non-profit organisations with charitable purposes that do not fit into one of the other categories.
Trade associations and trade unions
The data reveals a stark contrast in the prominence of trade associations in trade unions. 55 representatives of trade associations appeared as witnesses in this period, which was 9% of all witnesses. 78% of these witnesses were from trade associations representing the private sector, with 13% from the public sector and 8% from non-profits or higher education.
Several trade associations made repeated appearances: in the month we collected data, the Local Government Association and National Farmers Union each appeared at four sessions, while the Federation of Small Businesses appeared at three.
Trade unions provided eight witnesses in this period, only 1% of the total number. However, six of these were from the Police Federation, whose representatives appeared at two Home Affairs Committee sessions dealing with the ‘plebgate’ row. Just two witnesses from non-police trade unions appeared (0.3% of the total) – one each from the NASUWT and Unison. This does not include professional bodies – such as Royal Colleges for medical professions – which appeared 29 times in this period.
Independent experts
We categorised a number of witnesses as ‘independent experts’. Although it would of course be expected that all witnesses have expertise in the issue being discussed, in most cases witnesses are primarily sharing the views of the organisation they represent. Those we place in the independent expert category are university academics, researchers from think-tanks or private research firms, parliamentarians (excluding ministers), and individuals without any organisational affiliation.
There were 120 such witnesses in the data collection period, representing 21% of the total number. They were more prevalent at Lords committees, where 39% of witnesses were independent experts (compared to 14% in the Commons). Figure Four gives the breakdown of different types of expert.
Figure Four: Organisational affiliations of ‘independent expert’ witnesses (%)
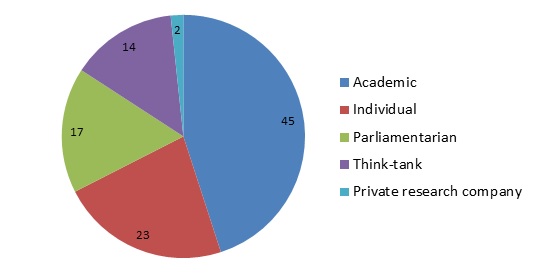
Twenty witnesses in this period were parliamentarians, (3% of all witnesses), including eight MPs and 12 peers. Three-quarters of these witnesses appeared at House of Lords committees. Indeed, the fact that over 10% of all witnesses at Lords committees were parliamentarians in this period may invite accusations that peers are spending too much time questioning their own colleagues.
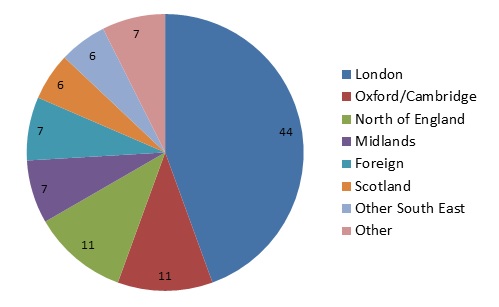
We examined the largest of the expert groups, academics, in more detail, in order to understand the geographical spread of these witnesses. Our analysis revealed that London universities were significantly over-represented among academic witnesses (see Figure Five). This, of course, reflects the location of Parliament and the greater convenience London academics have in appearing at select committees, although the disparity is wide enough to warrant further attention from committees in the future.
Figure Five: University academic witnesses by geographical location (%)
Part one of this analysis examined the gender imbalance among select committee witnesses. Read the findings on gender, or download the full research report.
—
Note: This post represents the views of the authors, and does not necessarily give the position of Democratic Audit or the London School of Economics. Please read our comments policy before commenting. Shortlink for this post: buff.ly/1cA26td
—
 Richard Berry is Managing Editor of Democratic Audit. His background is in public policy and political research, particularly in relation to local government. In previous roles he has worked for the London Assembly, JMC Partners and Ann Coffey MP. He tweets at @richard3berry.
Similar Posts
Subscribe
If you enjoyed this article, subscribe to receive more just like it.


 Democratic Audit's core funding is provided by the Joseph Rowntree Charitable Trust. Additional funding is provided by the London School of Economics.
Parliamentary select committees: who gives evidence? https://t.co/9kKrAPD6hO | @democraticaudit report | w/ #opendata: https://t.co/ooPZotQndg
@RuthBoyask Yes unfortunately – Wales, NI and SW all on 1.8%. Full data available via our post https://t.co/xlOgn6BOCe
@wouterpoortinga 1.8% of academics from Wales in period we studied. All data available via full post. https://t.co/eeS93N5KdW Why December?
@democraticaudit Thanks for info. Dec had EAC enquiry into #plasticbagcharge with representation from Wales
Britain dsc parful https:// https://t.co/ZhUJB8ENzs
RT @pashleyfisher: RT @PJDunleavy: New analysis reveals what types of organisations give evidence to UK parliamentary select committees htt…
@A_Glencross PT: 44% of academics appearing at select committees are based in London: https://t.co/TkGgY7Y7AF https://t.co/sty9xOSRqo
21% of select committee witnesses are ‘independent experts’ – findings from my research https://t.co/Bg0PJTsjvQ https://t.co/pT3dbxSaKc
RT @democraticaudit: 44% of academics appearing at select committees are based in London (Oct-Nov 2013). Breakdown: https://t.co/dPfwov5wPw …
New analysis reveals what types of organisations give evidence to UK parliamentary select committees https://t.co/3tnBdZwaMs
More detail on witnesses at select committees for Commons and Lords https://t.co/eo1vujZmOu https://t.co/My9bEWgVtc @katiewalpole @fedebruni
RT @richard3berry: What types of organisation give evidence at select committees? Breakdown for Commons and Lords https://t.co/K7kRfxjN5K ht…
21% of select committee witnesses are ‘independent experts’ – almost half university academics https://t.co/FxAnzymX7L https://t.co/LB1eadBuLd
Who gives evidence to select committees? @democraticaudit analysis https://t.co/haBvVObENA (by orgs) and https://t.co/cNy2AQSHRn (by gender)
Do select committees always talk to ‘usual suspects’? 9% of witnesses are from trade associations (my new research) https://t.co/OXDa1SSrEj
What types of organisation give evidence at select committees? Breakdown for Commons and Lords https://t.co/Z7BiuVnKpY https://t.co/AL27VEfdTz